FIGURE SUMMARY
Title

Altered brain-wide auditory networks in a zebrafish model of fragile X syndrome

Authors
Constantin, L., Poulsen, R.E., Scholz, L.A., Favre-Bulle, I.A., Taylor, M.A., Sun, B., Goodhill, G.J., Vanwalleghem, G.C., Scott, E.K.
Source
Full text @ BMC Biol.

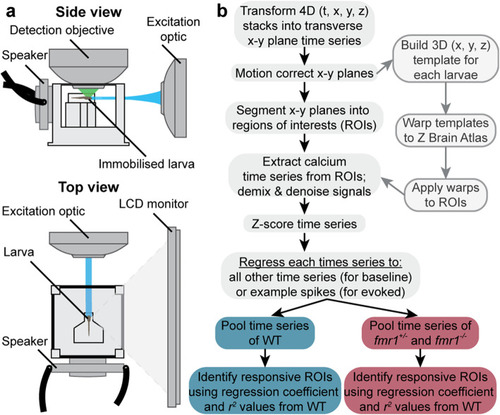
Imaging setup and neuroinformatic workflow. Schematic of the imaging setup (a) used to observe brain activity of zebrafish larvae. Summary of the neuroinformatic workflow (b) used to segment the images into ROIs, detect the activity, and then spatially register the response of each ROI to a reference brain

Brain-wide baseline and sensory-evoked neuronal activity. Distribution of brain-wide calcium event rates (a) in WT, fmr1+/−, and fmr1−/− larvae at baseline (mean ± s.e.m.). Heat map (b) of the correlation coefficient between pairs of ROIs as a function of their Euclidean distance, with the distribution of all coefficients (right) showing no marked differences between genotypes. Z-scored activity traces (c) of all ROIs responding to stimuli for each genotype (mean ± SD). Percent of ROIs (d) in the whole brain responding to each stimulus (mean ± s.e.m). Brain-wide responses to visual flow (e), visual loom (f), and auditory (g) stimuli (all panels equivalent to five larvae), where spot color represents response strength (regression coefficient) and spot diameter depicts coefficient of determination (r2 value). Ratio of ROIs (h), mean regression coefficients (i), and r2 values (j) in WT versus fmr1−/− responding to the auditory stimulus across various brain regions (mean ± s.e.m.). ON, octavolateralis nucleus; rHB, remaining hindbrain (without the cerebellum (Cb) and ON); Teg, tegmentum; TS, torus semicircularis; TeO, optic tectum; Pr, pretectum; Th, thalamus; Ha, habenulae; Tel, telencephalon. P values ≤ 0.1 are shown

Regional responses to a complex auditory stimulus train. Auditory responsive ROIs (a) in WT and fmr1−/− larvae (equivalent to five larvae). Z-scored activity trace (b) of all responsive ROIs (mean ± SD) with stimulus timing and amplitude represented (bottom). For each of six functional clusters across four brain regions (ch), the distribution of responsive ROIs (left), percent of all ROIs belonging to the cluster, mean response strength to each of eight stimulus amplitudes (top right), and mean z-scored activity trace during the first amplitude ramp and first twelve discrete amplitudes (bottom right). Spheres (ch, left) are color coded to genotype. Amplitudes are represented in decibels (dB) from full volume. ON, octavolateralis nucleus; Teg, tegmentum; TS, torus semicircularis; Th, thalamus. P values ≤ 0.1 are shown

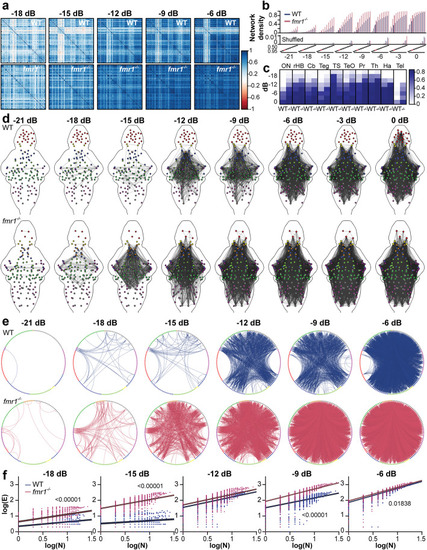
Functional brain-wide auditory networks in WT and fmr1−/− larvae. Correlation matrices (a) showing pairwise correlation strength across all pairs of nodes in WT (top) and fmr1−/− (bottom) larvae. Amplitudes are annotated as decibels from full volume (dB). Network density (b) of auditory sensitivity (top) and time-shuffled dataset (bottom) as a function of correlation coefficient thresholds and select. The 0.85 correlation coefficient threshold (red dash) was selected for subsequent analyses. The mean participation coefficient (c) for each region across eight amplitudes. Brain-wide auditory networks (d) showing edges exceeding a correlation coefficient of 0.85. Node color indicates brain region: octavolateralis nucleus (ON), magenta; cerebellum (Cb), dark green; hindbrain without the Cb and ON (rHB), gray; tegmentum (teg), light green; torus semicircularis (TS), dark magenta; optic tectum (TeO), blue; pretectum (Pr), light blue; thalamus (Th), orange; habenulae (Ha), yellow; telencephalon (Tel), red. Circle plots (e) of strongly correlated edges between nodes located in different brain regions (colored as d) for different sound amplitudes in WT and fmr1−/−. Log plots (f) of the number of nodes within a box (N) versus the number of edges crossing the box boundary (E) used to calculate the Rent exponent. Each dot represents an individual randomly placed and sized box (n = 5000), and the lines are robust linear regressions ± SD. P values ≤ 0.1 are shown

Population decoding of sound amplitude in different WT and fmr1−/− brain regions. Workflow (a) of population decoding analysis. For each brain region of interest, the neuronal activity in ROIs for each genotype (raster plot, top) was randomly split into 10 cross-validation subsets. “Ascending” auditory stimuli were fed to train the Xtreme Gradient Boosting (XGB) decoder, the “quasi-random” auditory stimuli were used to test the decoder, and the “descending” auditory stimuli to validate the predictions. The output of the decoder analysis for the telencephalon (tel) is shown (bottom) as a time trace of the stimulus features (black dotted line) versus predicted responses (colored solid line). Mean r2 (b) of auditory clusters decoding amplitude intensity in WT and fmr1−/− larvae for brain regions of interest. Note brain regions are depicted in approximate order of the ascending sensory pathway. ON, octavolateralis nucleus; rHB, remaining hindbrain (without the cerebellum (Cb) and ON); Teg, tegmentum; TS, torus semicircularis; TeO, optic tectum; Pr, pretectum; Th, thalamus; Ha, habenulae; Tel, telencephalon. Corrected P values ≤ 0.01 are shown

Acknowledgments
This image is the copyrighted work of the attributed author or publisher, and ZFIN has permission only to display this image to its users. Additional permissions should be obtained from the applicable author or publisher of the image. Full text @ BMC Biol.