
- Title
-
Hypothalamic Pomc Neurons Innervate the Spinal Cord and Modulate the Excitability of Premotor Circuits
- Authors
- Reinoß, P., Ciglieri, E., Minére, M., Bremser, S., Klein, A., Löhr, H., Fuller, P.M., Büschges, A., Kloppenburg, P., Fenselau, H., Hammerschmidt, M.
- Source
- Full text @ Curr. Biol.

Figure 1. Pomca Neurons Target Spinal (Pre-)Motor Circuits in Zebrafish Larvae (A) Schematic illustration of the imaged region. (B–D) Immunohistochemistry of pomca:EGFPras crossed to vsx2:Gal4FF; UAS-E1b:nfsb-mCherry transgenic larvae of 10–11 mm standard length (SL). (B) shows lateral view of whole-mount spinal cord preparation; top panel shows maximum intensity projection; for boxed region, single-plane images are shown below (see also Video S1 for z stack). (C) and (D) show transverse sections of the spinal cord. (C) Pomca projections are in proximity (arrow) or more distant (arrowhead) to V2a neurons. (D) Motoneurons backfilled with rhodamine-dextran in proximity to Pomca projections. (E) Dorso-ventral topology of Pomca projections in transverse sections of the spinal cord at SL 10. Position of ascending neurons adapted from Pedroni and Ampatzis [34]. (F) Dorso-ventral quantification of Pomca and V2a contacts. (G–I) Colorimetric in situ hybridization for mc4r, vsx2, and gfp (in mnx1:GFP transgenic animal) on spinal transverse sections at 9–10 mm SL. (J) Lateral view of whole-mount spinal cord at 9 mm SL stained with colorimetric in situ hybridization against mc4r. Motoneurons without signal (arrowhead) and with signal (arrow) are magnified in the right panel. (K) mc4r colorimetric in situ hybridization signal overlapped with fluorescence of V2a neurons of vsx2:GFP transgenic animal. Right panels show magnified views of exemplary neurons of indicated categories from different sections. (L) Quantification of co-localization in images as in (K) and the defined regions of interest (ROI, right panel). N = 3 animals, n = 9 spinal cord sections. cc, central canal; ma, Mauthner axons; D, dorsal; P, posterior; M, medial; L, lateral; n.s., not significant. Error bars show 95% confidence intervals. Scale bars, 25 μm. EXPRESSION / LABELING:
|

Figure 3. Manipulation of the Mc4r System Affects Locomotor Activity in Zebrafish and Mice (A) Behavior paradigm for video recordings of fasted or sated larvae at 8–9 mm SL. (B) Representative trajectories of 5 min high-magnification video recordings of a fasted and sated larva in the presence of paramecia (prey), with individual paramecia uptake events indicated by purple circles. (C) Plot shows velocity over time and the threshold (dashed line, 6 mm/s) to detect a swim bout. (D) Plots depicting increased locomotion of fasted compared to sated larvae during foraging and feeding (Error bars show 95% confidence intervals; ∗p < 0.05, ∗∗p < 0.01; N = 12). (E and F) Distance traveled in presence of food in fasted (E) and sated (F) larvae (Error bars show 95% confidence intervals; columns with the same superscript letter (a, b, c) are not significantly different (p > 0.05); N = 12). (G) Experimental schematic in mice (left) and expression of Cre-dependent AAV-FLEX-hGlyR-mCherry in ARCPomc neurons (right) as determined by immunolabeling. Scale bar, 100 μm. (H) Effects of hGlyR/Ivermectin-induced inhibition of mouse ARCPomc neurons on locomotor activity in presence of food (Error bars show 95% confidence intervals;∗p < 0.05). PHENOTYPE:
|
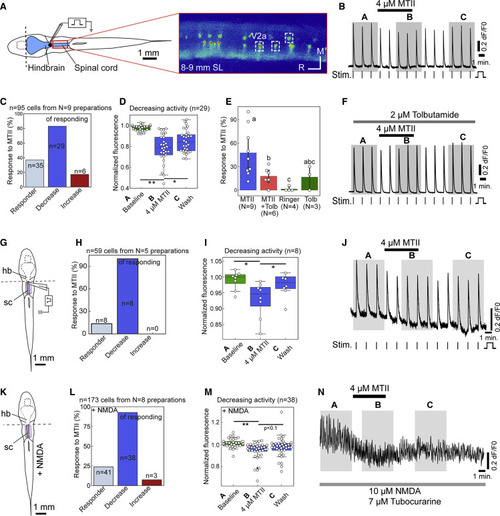
Figure 4. Zebrafish Spinal Networks Respond to the Mc4r Agonist MTII (A) Schematic illustration of the hindbrain-spinal cord preparation (in blue) and exemplary still of Ca2+ transients in spinal V2a neurons of vsx2:Gal4FF; 14xUAS:GCaMP6s larvae of 8–9 mm SL fasted for 1 day, with settings allowing simultaneous recordings in all dorso-ventral planes of the spinal cord. (B) Exemplary recording of individual V2a interneuron showing decreased Ca2+ transients upon bath application of 4–5 μM MTII. Horizontal bars indicate when MTII, vertical bars when the electrical stimuli (Stim) were applied. Shaded areas (A–C) indicate when Ca2+ transients were quantified for (D), (I), and (M). (C) Percentages of V2a neurons responding to applied MTII according to 3-σ criterion (see STAR Methods). (D) Percentages of V2a neurons in which evoked Ca2+ transients were reduced by MTII in a reversible manner. (E and F) The K-ATPase blocker tolbutamide (Tolb, 2 μM) had no major effect on Ca2+ transients (p = 0.81) but prevented the normally decreasing effect of MTII (p = 0.01). (G–J) Schematic illustration of hindbrain-spinal cord preparation for electrical stimulation with section (dashed line) between hindbrain and spinal cord (G), percentages of V2a neurons responding to applied MTII (H), fluorescence values for V2a neurons with a reversible negative response (I), and exemplary recording of individual electrically stimulated V2a interneuron (J). (K–N) Schematic illustration of hindbrain-spinal cord preparation for 10 μM NMDA stimulation with section between hindbrain and spinal cord (K), percentages of V2a neurons responding to applied MTII (L) fluorescence values for V2a neurons with a reversible negative response (M), and exemplary recording of individual NMDA-stimulated V2a interneuron. Tubocurarine was used to prevent muscle contractions. Columns show mean ± 95% confidence intervals; columns with the same superscript letter (a, b, c) are not significantly different (p > 0.05); ∗p < 0.05, ∗∗p < 0.01. Scale bars, 1 mm. |

Figure 6. Disruption of Mc4r Signaling in Zebrafish V2a Neurons Modulates Swimming Behavior (A) Schematic illustration of a dominant-negative Mc4r with a D90N amino acid exchange. (B) Alignment indicates that Mc4r D90N mutation is localized in a highly conserved region. (C and D) Swimming behavior of vsx2:Gal4FF; UAS:Mc4r(D90N) double-transgenic larvae and non-transgenic controls in absence of food (C) and with food (D) showed significant differences in swim bout frequencies (N = 8 animals; ∗p < 0.05, ∗∗p < 0.01; error bars show 95% confidence intervals). (E) Comparison of effects of V2a-specific dnMc4r / Mc4r(D90N) (N = 8) with the effects of the Mc4r antagonist SHU9119 (N = 12; see Figure S4), each relative to the corresponding controls. |