FIGURE SUMMARY
Title

Generation and characterization of keap1a- and keap1b-knockout zebrafish

Authors
Nguyen, V.T., Bian, L., Tamaoki, J., Otsubo, S., Muratani, M., Kawahara, A., Kobayashi, M.
Source
Full text @ Redox Biol.

The comparison of Keap1 proteins.

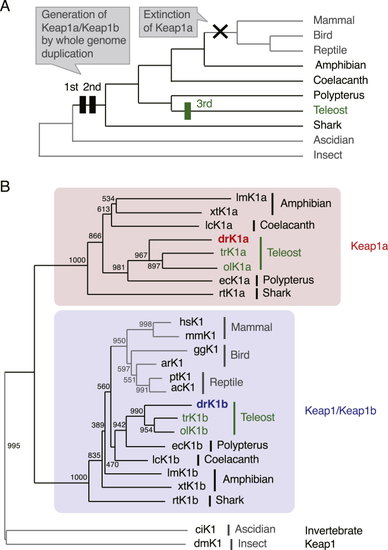
(A) Simplified phylogeny of vertebrate and invertebrate animals. Black and green rectangles represent two WGD events that occurred early in vertebrate evolution and an additional WGD in the teleost ancestor, respectively.

(B) Phylogenetic tree of Keap1 family proteins. Amino acid sequences in the broad complex, tramtrack and bric-a-brac domains–intervening region (BTB–IVR) were obtained from GenBank (
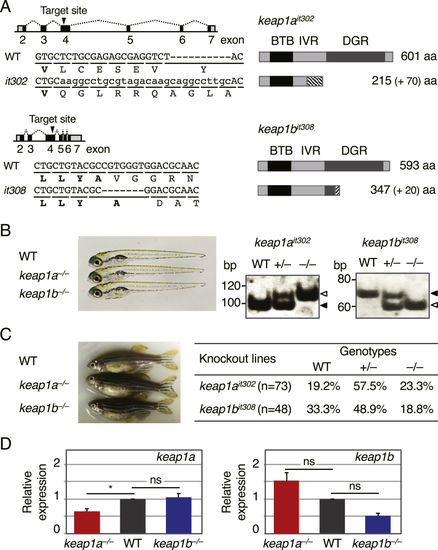
http://www.ncbi.nlm.nih.gov/) and NewtBase (http://newtbase.eko.uj.edu.pl/). Accession numbers: lmK1a, c152694_g1_i1 (NewtBase contig); xtK1a, XM_012953851; lcK1a, XM_014486756; drK1a, NM_182864; trK1a, XM_011618924; olK1a, XM_004082216; ecK1a, XM_028816380; rtK1a, XM_020523471; hsK1, NM_203500; mmK1, NM_016679; ggK1, KU321503; arK1, XM_026068028; ptK1, XM_026711369; acK1, XM_003216399; drK1b, NM_001113477; trK1b, XM_003972594; olK1b, XM_023955710; ecK1b, XM_028823679; lcK1b, XM_005994311; lmK1b, c118729_g1_i1 (NewtBase contig); xtK1b, NM_001008023; rtK1b, XM_020519602; ciK1, XM_002128019; dmK1, NM_142337. Abbreviations: ac, Anolis carolinensis (lizard); ar, Apteryx rowi (kiwi); ci, Ciona intestinalis (ascidian); dm, Drosophila melanogaster (fly); dr, Danio rerio (zebrafish); ec, Erpetoichthys calabaricus (snakefish); gg, Gallus gallus (chicken); hs, Homo sapiens (human); lc, Latimeria chalumnae (coelacanth); lm, Lissotriton montandoni (newt); mm, Mus musculus (mouse); ol, Oryzias latipes (medaka); pt, Pseudonaja textilis (snake); rt, Rhincodon typus (shark); tr, Takifugu rubripes (pufferfish); xt, Xenopus tropicalis (frog). Of note, all 74 teleosts in the Ensembl Genome Browser have both Keap1a and Keap1/Keap1b genes, while all 104 mammals, 13 birds and 11 reptiles have only Keap1/Keap1b. (For interpretation of the references to colour in this figure legend, the reader is referred to the Web version of this article.)

The generation ofkeap1a-andkeap1b-knockout zebrafish.

(A) Gene knockout of keap1a and keap1b using CRISPR–Cas9 technology. CRISPR target sites were designed in exon 4 of the keap1a and keap1b loci (black arrowheads). In keap1ait302 and keap1bit308 lines, 70- and 20-amino acids-extra peptides were added after the original Val215 in Keap1a and after the original Ala347 in Keap1b proteins, respectively (diagonal stripes).

(B) keap1a- and keap1b-homogygous knockout larvae at 5 dpf. No obvious differences were observed between wild-type and knockout larvae. Right panels show PCR genotyping of keap1ait302-and keap1bit308-knockout larvae. WT, +/– and −/− indicate wild-type, heterozygous and homozygous fish, respectively. Open and closed arrowheads denote knockout and wild-type alleles, respectively.

(C) keap1ait302-and keap1bit308-homozygous knockout adults at 4 mpf. No obvious differences were observed between wild-type and knockout adults (females in this picture). The genotypes of 4-mpf adults derived from heterozygous parents were roughly according to the expected Mendelian ratio.

(D) The relative expression of keap1a and keap1b in wild-type, homozygous keap1ait302-and keap1bit308-knockout larvae at 5 dpf analyzed by qPCR. The expression of wild-type specimens was normalized to 1. Each experiment was conducted at least four times with duplicate samples. Asterisks indicate significant differences (*p < 0.05). ns, not significant.

Altered genes and pathways in keap1a- and keap1b-knockout larvae.

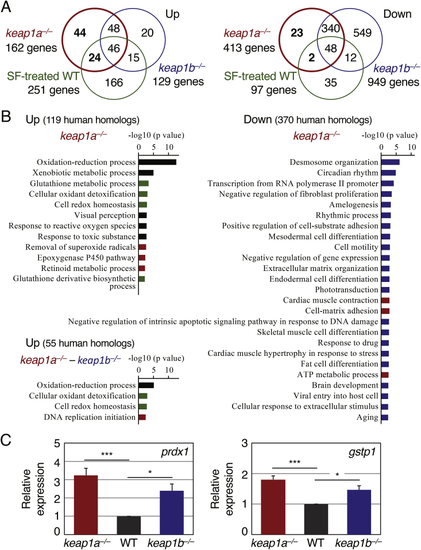
(A) Venn diagrams showing up- (left) and down-regulated genes (right) in 5-dpf larvae of keap1ait302-and keap1bit308-homozygous knockout larvae and of wild-type AB larvae treated with 40 μM sulforaphane identified by an RNA-seq analysis in comparison with untreated AB larvae.

(B) A GO enrichment analysis of biological processes in keap1a- and keap1b-knockout larvae. Red, blue, green and black bars indicate the processes enriched in only keap1a-knockout larvae, both keap1a- and keap1b-knockout larvae, both keap1a-knockout and sulforaphane-treated AB larvae, and all three larvae, respectively.

(C) The comparison of the basal expression of Nrf2 target genes between wild-type and Keap1 knockout larvae. The expression of prdx1 and gstp1 in wild-type AB, keap1a- and keap1b-knockout larvae at 5 dpf was analyzed by qPCR. The expression in wild-type specimens was normalized to 1. Each experiment was conducted at least four times with duplicate samples. Asterisks indicate significant differences (*p < 0.05, ***p < 0.001). (For interpretation of the references to colour in this figure legend, the reader is referred to the Web version of this article.)

Survival assays ofkeap1a-andkeap1b-knockout larvae against H2O2.

(A) The survival rate of keap1ait302 and keap1bit308 larvae after exposure to H2O2. At 4 dpf, larvae were exposed to 2 mM of H2O2, and the survival was observed every 12 h until 9 dpf. Tested numbers were as follows: keap1ait302 (WT n = 53, +/– n = 99, −/− n = 46), keap1bit308 (WT n = 59, +/– n = 107, −/− n = 45). Data from four independent experiments were combined.

(B) The survival rate of keap1ait302;nfe2l2afh318 and keap1bit308;nfe2l2afh318 compound mutant larvae. Tested numbers were follows: keap1ait302;nfe2l2afh318 (−/−;WT n = 16, −/−; +/m n = 25, −/−;m/m n = 17, –/+; WT n = 31, –/+; m/+ n = 94, –/+; m/m n = 45, WT; WT n = 16, WT; +/m n = 38, WT; m/m n = 21), keap1bit308;nfe2l2afh318 (−/−;WT n = 22, −/−; +/m n = 31, −/−;m/m n = 18, –/+; WT n = 32, –/+; m/+ n = 79, –/+; m/m n = 37, WT; WT n = 37, WT; +/m n = 50, WT; m/m n = 26). Data from four independent experiments were combined. Asterisks indicate significant differences (*p < 0.05, **p < 0.01, ***p < 0.001).

The effect of sulforaphane pretreatment on the survival of zebrafish larvae after exposure to H2O2.

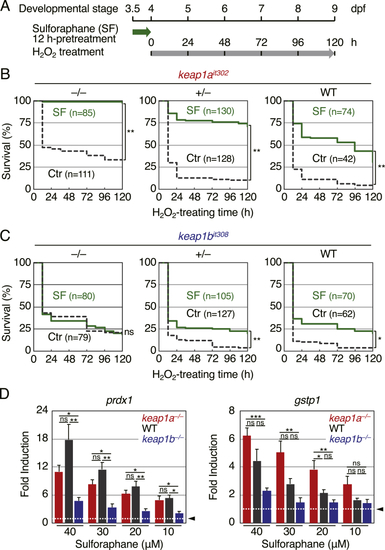
(A) A schematic illustration of the experiment. Larvae were treated with 2

mM of H2O2 at 4 dpf after 12-h pretreatment with 40 μM sulforaphane (SF).

(B, C) The survival rate of keap1ait302 and keap1bit308 larvae.

(D) The fold increase in the expression of Nrf2 target genes in keap1a- and keap1b-homozygous knockout and wild-type larvae with sulforaphane treatment. Larvae at 5 dpf were treated with or without sulforaphane at the indicated concentration for 6 h, and the expression of prdx1 and gstp1 was analyzed by qPCR. The expression of untreated larvae was normalized to 1 (arrowheads, white dotted lines). Each experiment was conducted at least three times with duplicate samples. Asterisks indicate significant differences (*p < 0.05, **p < 0.01, ***p < 0.001). ns, not significant.

Acknowledgments
This image is the copyrighted work of the attributed author or publisher, and ZFIN has permission only to display this image to its users. Additional permissions should be obtained from the applicable author or publisher of the image. Full text @ Redox Biol.