
- Title
-
Rapid Effects of Selection on Brain-wide Activity and Behavior
- Authors
- Pantoja, C., Larsch, J., Laurell, E., Marquart, G., Kunst, M., Baier, H.
- Source
- Full text @ Curr. Biol.
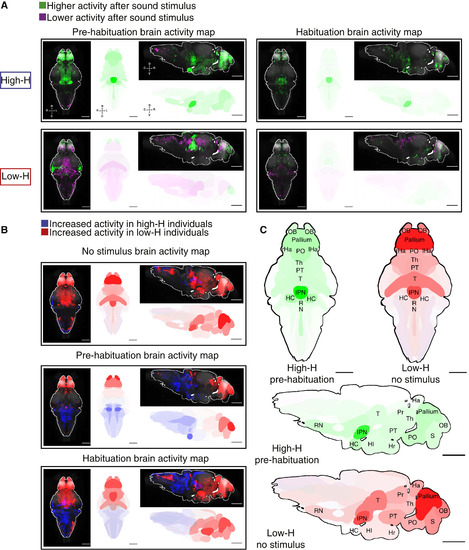
Comparison of Brain Activity between High-H and Low-H Animals (A) Whole-brain activity maps comparing sound-induced neural activity in low-H and high-H individuals. Magenta or green represents voxels/brain region masks more active in unstimulated or stimulus conditions, respectively. See also Videos S1 and S2. Unstimulated high-H, n = 21; unstimulated low-H, n = 9; startle pre-habituation high-H, n = 21; startle pre-habituation low-H, n = 22; startle post-habituation high-H, n = 18; startle post-habituation low-H, n = 9. (B) Blue or red represents voxels/brain region masks more active in high-H or low-H animals, respectively. See also Video S3. Unstimulated high-H, n = 21; unstimulated low-H, n = 9; startle sensitivity high-H, n = 21; startle sensitivity low-H, n = 22; startle habituation high-H, n = 18; startle habituation low-H, n = 9. Images show maximum Z-projection of whole-brain Z stacks of voxels or brain regions. Color intensity in brain regions is proportional to the percentage of voxels scored as higher activity in one group versus the other. Scale bars, 100 μm. (C) Enlarged view of data shown in (A) upper left and (B) top panels. Ha, habenula; HC, caudal hypothalamus; HI, intermediate hypothalamus; Hr, rostral hypothalamus; IPN, interpeduncular nucleus; OB, olfactory bulb; PO, preoptic region; Pr, pretectum; PT, posterior tuberculum; RN, raphe nucleus; S, subpallium; Th, thalamus; T, tegmentum. See also Figure S2. |