
- Title
-
Behavioral Signatures of a Developing Neural Code
- Authors
- Avitan, L., Pujic, Z., Mölter, J., McCullough, M., Zhu, S., Sun, B., Myhre, A.E., Goodhill, G.J.
- Source
- Full text @ Curr. Biol.
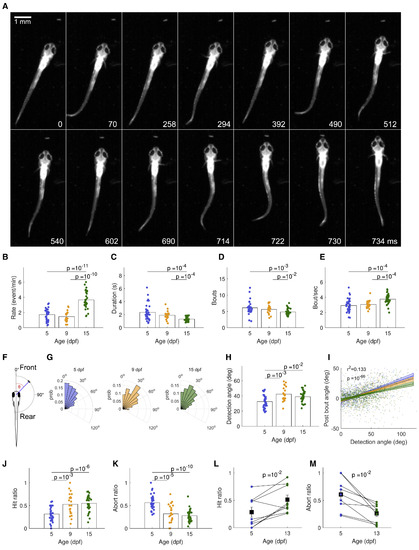
(A) A sequence of frames during a hunting event from the moment of prey detection (0 ms), showing orientation and eye convergence (70 ms), approach (294, 512 ms), strike (714–730 ms), and prey capture (734 ms). (B) Hunting event rate is higher for 15-dpf than for 5- and 9-dpf fish(t test) (C) Hunting events become shorter over development (Wilcoxon rank-sum). (D) Number of bouts per event is lower for 15-dpf than for 9- and 5-dpf fish (Wilcoxon rank-sum).. (E) Bout rate is higher at 15 dpf than at 5 and 9 dpf (t test). (F) Detection angle is defined as the angle between a Paramecium and the midline of the fish just prior to eye convergence. (G) Distributions of prey detection angle for 5-, 9-, and 15-dpf fish change over development (5 versus 9, ; 5 versus 15, ; 9 versus 15, ; two-sample Kolmogorov-Smirnov test). (H) 9- and 15-dpf fish detect Paramecia at larger angles (i.e., toward the rear visual field) than do 5-dpf fish. (I) The relation between prey detection angle and angle to prey after the first bout (here, each point represents a bout rather than a fish). Multiple regression analysis (see STAR Methods) reveals a positive correlation between detection angle and post-bout angle, indicating that the fish undershoot the turn (coefficient ; ) and that the degree of undershoot reduces with age (coefficient ; ). Turn angle does not change with age independently of prey angle (; ). Solid lines show the fitted regression model for each age. Shaded regions show the 95% confidence intervals for each slope. statistic and p value shown are for the overall model. For clarity, the small number of turns falling outside the range between −50 and 50 degrees are not plotted. (J) Hunting performance, as measured by the proportion of all hunting events per fish which are successful, increases over development (t test). (K) Abort ratio decreases over development (t test). (L) Hunting performance of individuals imaged at both 5 and later at 13 dpf increases over development (paired-sample t test). Black squares represent the mean; bars, SEMs. (M) Abort ratio of individuals imaged at both 5 and later at 13 dpf decreases over development (paired-sample t test). Black squares represent the mean; bars, SEMs. |

(A) An example tectal image from a 15-dpf fish. The neuropil (NP) contour of each fish was fitted with an ellipse, with the major axis defining the tectal anterior-posterior (AP) axis. Periventricular layer (PVL), NP, anterior (A), and posterior (P) ends of the tectum are indicated. Inset: larvae were embedded in agarose with one eye facing the projected image for 2-photon calcium imaging. We recorded evoked activity at a depth of 70 μm in response to 20 trials of the stimulus set consisting of spots at positions 45°, 60°, 75°, 90°, 105°, 120°, 135°, 150°, and 165° of the visual field, where 0° was defined as the body axis. (B) Schematic of retinotectal projection showing temporal retinal ganglion cells (green, representing the frontal visual field) projecting to anterior tectum and nasal ganglion cells (blue, representing the rear visual field) projecting to posterior tectum. The dashed black rectangle represents the tectal region shown in (A). (C) Population response of 187 PVL neurons from the fish shown in (A) elicited by two trials of visual stimuli set. Neurons are sorted by their position on the AP axis. (D) Raw receptive fields of 217 and 187 PVL neurons in an example 4 dpf (left) and 15 dpf (right) fish, respectively. Neurons are sorted by their position on the AP axis and display a rough topography. (E) Raw (black) and fitted (blue) receptive field of an example neuron from a 15 dpf fish shown in (C) and (D) (neuron 123). (F) Mean receptive field width did not change over development (t test). (G) More neurons were tuned to the rear visual field at 4 dpf, but this gradually balanced over development. Shading represents SEMs. Comparing the area under the curve grouped by age showed differences as follows: 4 versus 5, n.s.; 4 versus 9, ; 4 versus 15, ; one-way ANOVA with Bonferroni multiple-comparison correction. (H) Neuronal selectivity shifted over development so that at each tectal position, neuronal tuning moved in a frontal direction. Shading represents SEMs. A linear fit to these curves showed similar slopes but different intersection points with the x axis, indicating that maps are shifted (4 versus 15, , for slopes, and for intercepts t test). (I) Topography improved over development (two-sample t test). Variability also decreased over development (4 and 5 versus 9 and 15, , two-sample F-test). (J) At 4 dpf, the population response amplitude was stronger in response to the rear visual field, but this balanced over development to give a more even response amplitude to stimuli across the visual field. (K) At 4 dpf, a larger proportion of neurons were active in response to stimuli in the rear visual field, but again, this balanced over development. |