FIGURE SUMMARY
Title

Mycobacterium marinum phthiocerol dimycocerosates enhance macrophage phagosomal permeabilization and membrane damage

Authors
Osman, M.M., Pagán, A.J., Shanahan, J.K., Ramakrishnan, L.
Source
Full text @ PLoS One

PDIM transport to the outer mycomembrane is required for optimal phagosomal permeabilization by <italic>M</italic>. <italic>marinum</italic>.

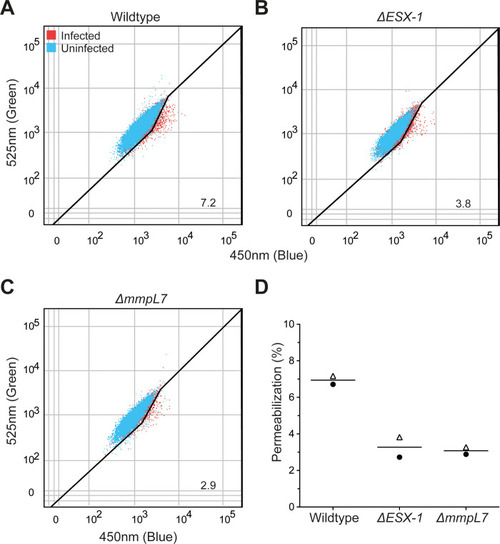
Representative dot plots of (A) wildtype, (B) ΔESX-1, and (C) ΔmmpL7 infected THP-1 macrophages 24 hours post infection with overlays of uninfected (blue) and infected (red) cells within each sample. Gating outlined in black, % permeabilization is as labeled. Plots are representative of two independent experiments. (D) Quantification of permeabilization events. Each point represents an independent experiment, symbols indicate matched experiments.

PDIM transport deficiency reduces <italic>M</italic>. <italic>marinum</italic>-induced phagosomal membrane damage.

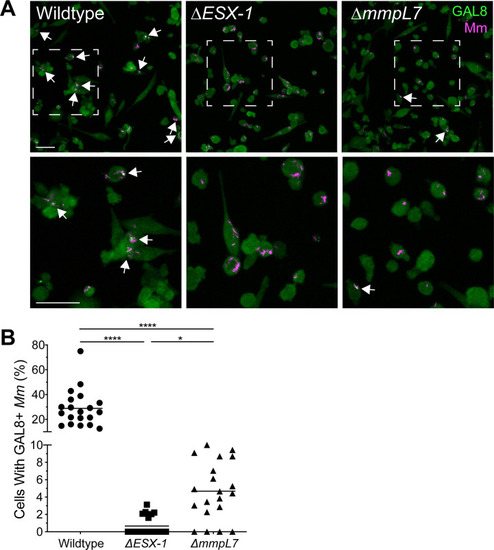
(A) Maximum intensity projections of confocal micrographs showing galectin-8 labeling of PMA-differentiated THP-1 cells infected with tdTomato-expressing wildtype or mutant M. marinum strains 22 hours post infection. Arrows indicate co-localization of Galectin-8 (green) and M. marinum (magenta) fluorescence. Bottom panels show close-up views of the corresponding boxed regions in the top panels. Scale bars, 50μm. (B) Percent of infected cells that have mycobacterial foci labeled with galectin-8. Symbols represent individual imaging fields. Horizontal lines depict mean values. The respective means and 95% confidence intervals for wildtype, ΔESX-1 and ΔmmpL7 infections are 28.9 (22.0–35.8), 0.7 (0.2–1.2), and 4.7 (3.1–6.3). Statistical significance was determined using a Kruskal-Wallis nonparametric test with Dunn’s post-hoc test to control for multiple comparisons, **** p < 0.0001, * p < 0.05. Data are representative of two experiments.

PDIM-deficient <italic>M</italic>. <italic>marinum</italic> retain hemolytic activity.

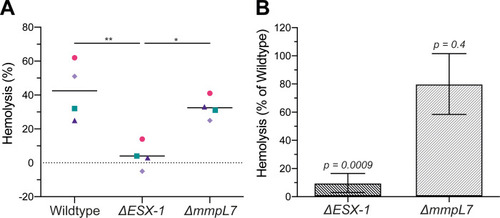
(A) 2-hour hemolysis of sheep red blood cells following incubation with wildtype, ΔESX-1 and ΔmmpL7 M. marinum relative to a Triton X-100 control. Statistical significance was determined by one-way ANOVA with Tukey's post-test. *p < 0.05, ** p < 0.01, otherwise, p > 0.05. Symbols represent matching experimental replicates. Pink circles, green squares, dark purple triangles and light purple diamonds are the first, second, third, and fourth replicates, respectively. (B) ΔESX-1 and ΔmmpL7 M. marinum hemolysis from (A) normalized to wildtype for each of four experiments. p-values, one-sample t-test against a hypothetical mean of 100% Error bars, mean +/- S.E.M.

Acknowledgments
This image is the copyrighted work of the attributed author or publisher, and ZFIN has permission only to display this image to its users. Additional permissions should be obtained from the applicable author or publisher of the image. Full text @ PLoS One