
- Title
-
Bsx Is Essential for Differentiation of Multiple Neuromodulatory Cell Populations in the Secondary Prosencephalon
- Authors
- Schredelseker, T., Veit, F., Dorsky, R.I., Driever, W.
- Source
- Full text @ Front. Neurosci.
|
|

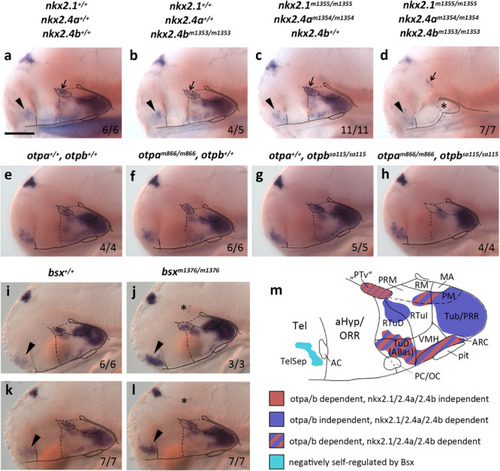
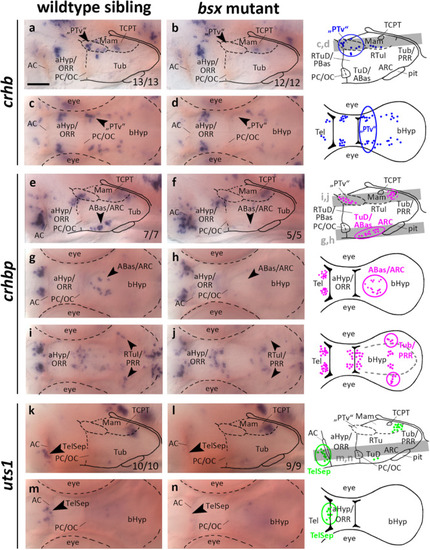
Forebrain patterning is normal in EXPRESSION / LABELING:
|
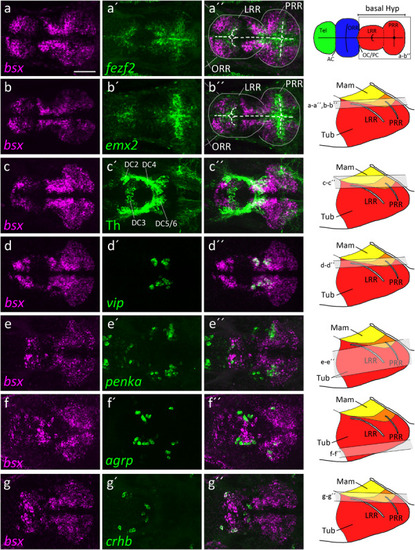
EXPRESSION / LABELING:
PHENOTYPE:
|
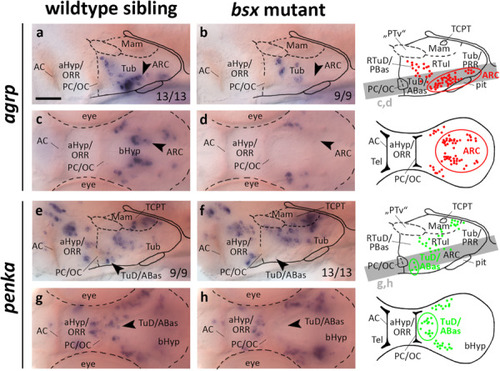
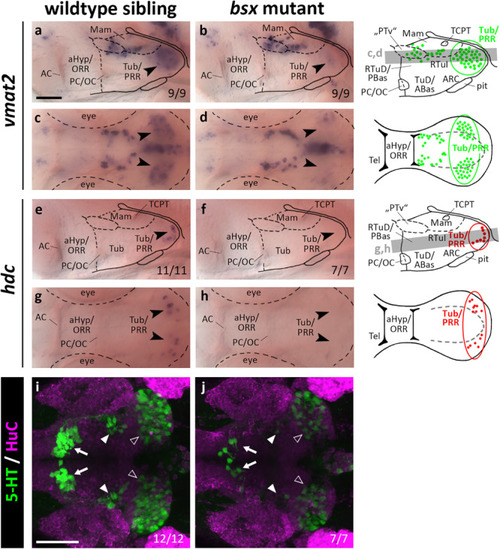
EXPRESSION / LABELING:
PHENOTYPE:
|
EXPRESSION / LABELING:
PHENOTYPE:
|
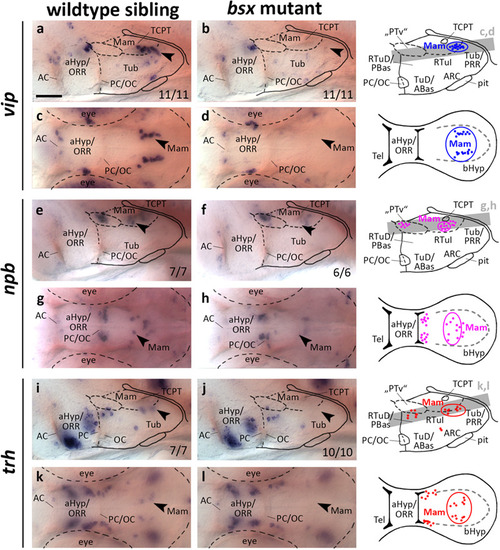
EXPRESSION / LABELING:
PHENOTYPE:
|
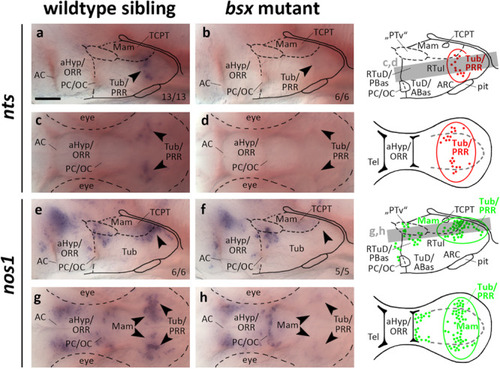
EXPRESSION / LABELING:
PHENOTYPE:
|
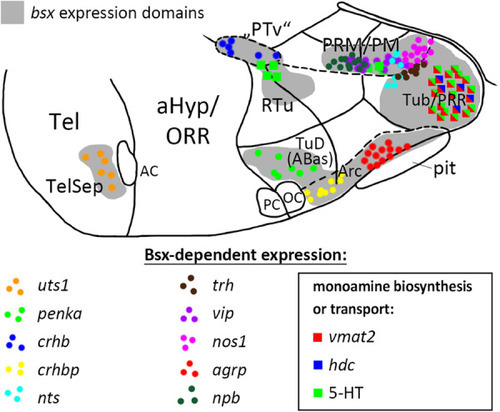
Distribution of Bsx-dependent neuronal cell types. Schematic representation of a sagittal view of the ventral forebrain in 3–4 dpf embryos showing |