
- Title
-
Pervasive changes of mRNA splicing in upf1-deficient zebrafish identify rpl10a as a regulator of T cell development
- Authors
- Lawir, D.F., Sikora, K., O'Meara, C.P., Schorpp, M., Boehm, T.
- Source
- Full text @ Proc. Natl. Acad. Sci. USA
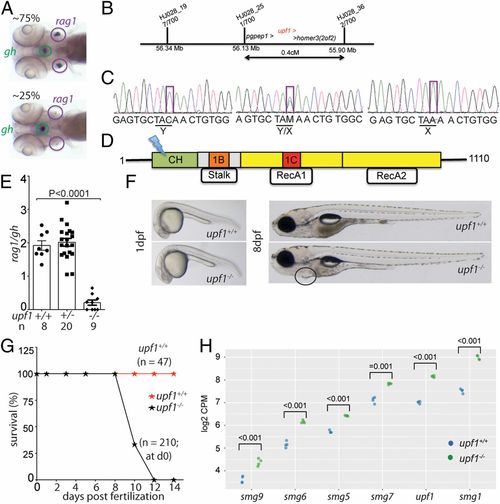
Characterization of a upf1 mutant allele. (A) In line HJ028, crosses of mutant carriers generate about 25% of fish with small numbers of rag1-expressing cells in the thymic rudiment, whereas the other siblings appear phenotypically normal. The expression of gh in cells of the hypophysis serves as an internal control. Note that some upf1 mutant fish lack detectable expression of rag1 (compare with quantitative analysis in E). (B) Schematic of the critical region for the HJ028 mutation on chromosome 2, as determined by linkage mapping with polymorphic markers and genome sequencing; the three genes located in the interval are indicated; the numbers of recombinants for each of the polymorphic markers observed in 700 meioses are indicated. (C) Sanger sequencing traces of the three genotypes in the HJ028 line. The C > A transversion is indicated (position 2:56,181,617; Zv11). (D) Schematic of the upf1 protein domains; cysteine- and histidine-rich zinc-finger domain (CH), amino acids 121 to 272; 1B/Stalk: amino acids 325 to 426; 1C: amino acids 567 to 620; RecA1: amino acids 449 to 700; RecA2: amino acids 701 to 918. The stop codon is introduced at amino acid position 163 (Y163X) in the cysteine- and histidine-rich zinc-finger domain. (E) Thymopoietic capacity of upf1 mutants as measured by RNA in situ hybridization using probes specific for rag1 (expressed in developing thymocytes) and gh (expressed in a subset of cells in the hypophysis). The latter probe serves as an internal control in two ways: Technical, to monitor the hybridization process as such; and biological, to ascertain the tissue specificity of the observed genetic effects. Each data point represents one fish; mean ± SEM. (F) Macroscopic appearance of upf1 mtants and their wild-type siblings at two time points. The cardiac region of the mutant is highlighted; the edema manifests itself as a ventral bulge, which is absent in wild-type siblings. (Magnification: 10×.) (G) Impaired survival of upf1 mutants. The survival rate of upf1 mutants was determined by analyzing aliquots of a clutch of initial 210 fish generated by a cross of heterozygous parents; the survival rate of upf1 wild-type fish was determined from a cross of wild-type fish of the same background. (H) Up-regulation of genes encoding components of the NMD pathway in upf1 mutants. Gene-level expression is shown as log2 counts per million (CPM); the levels of significance of differences between the two datasets for each gene are indicated. |
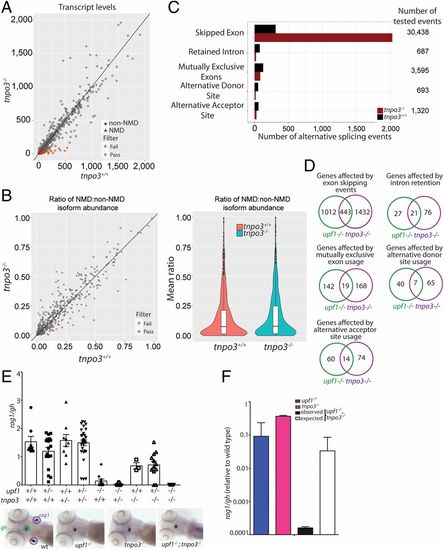
Characterization of the transcriptome of tnpo3 mutants at 5 dpf. (A) Differential transcript-level expression analysis of wild-type and mutant fish. Expression levels are depicted as TPM. (B) Minor effects on NMD ratios (Left); violin plot of NMD ratios (Right) (P = not significant). (C) Summary of differential splicing analysis. (D) Comparison of alternative splicing events between upf1 and tnpo3 mutants. The numbers of unique events are indicated for each class. (E) Synthetic interaction of upf1 and tnpo3 mutations. The thymopoietic capacities (expressed as rag1/gh ratios) of the nine genotypes resulting from an intercross of double heterozygous upf1+/−;tnpo3+/− parents are indicated. Each data point represents one fish; mean ± SEM. Representative WISH results for the key genotypes are shown (Lower). (Magnification: 10×.) (F) Comparison of phenotypes of the two single mutants (upf1−/− and tnpo3−/−, respectively), and the upf1−/−;tnpo3−/− double mutant; the latter phenotype is compared to the expected phenotype (multiplicative model). The thymopoietic capacity observed in the double mutant is significantly lower than expected from the combination of the single mutants, calculated under the assumption of no genetic interaction, indicative of synthetic genetic interaction. |
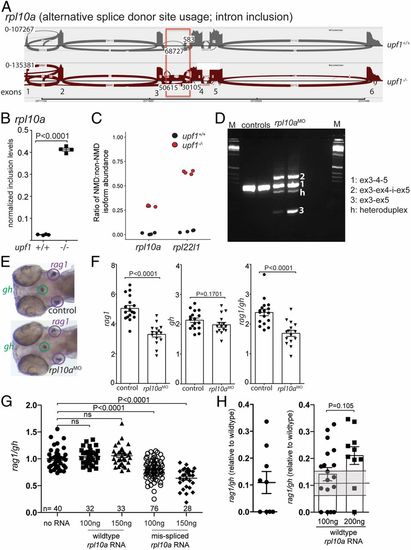
Requirement of rpl10a for T cell development. (A) Increased alternative splice donor site usage downstream of exon 3 (boxed) of the rpla10a gene in upf1 mutants. The transcript identifier for the NMD transcript is ENSDART00000138427.3. (B) Inclusion levels of intronic sequences in wild-type and upf1 mutant fish. (C) Increased NMD/non-NMD ratios for rpl10a and rpl22l1 in upf1 mutants. Black circles, upf1+/+; red circles, upf1−/−. (D) Transcript structure in rpl10a morphants generated by blocking the splice donor site of exon 4 with a site-specific antisense oligonucleotide. The composition of cDNAs as determined by direct sequencing of amplicons is indicated. (E) Representative WISH result for rpl10a morphants in D. Each data point represents one fish; mean ± SEM. (Magnification: 15×.) (F) The thymopoietic capacity of rpl10a morphants was calculated from rag1 (Left), gh (Center), and expressed as rag1/gh ratios (Right). (G) Detrimental effect of misspliced rpl10a mRNA on T cell development in zebrafish larvae. After injection of the indicated amounts of the two relevant RNA isoforms (compare with A), the thymopoietic index was determined at 5 dpf. (H) Alleviation of impaired T cell development in upf1 mutant larvae after injection of wild-type rpl10a mRNA as determined at 5 dpf. The thymopoietic indices are shown for uninjected upf1 mutants (data from Fig. 1E) (Left) and upf1 mutants injected with two different amounts of RNA (Right). Each data point represents one fish; mean ± SEM. |