FIGURE SUMMARY
Title

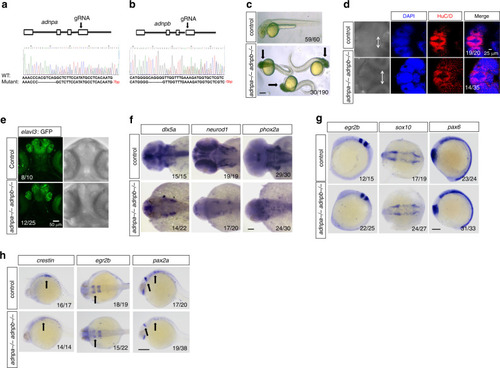
ADNP promotes neural differentiation by modulating Wnt/β-catenin signaling

Authors
Sun, X., Peng, X., Cao, Y., Zhou, Y., Sun, Y.
Source
Full text @ Nat. Commun.

Generation of <italic>Adnp−/−</italic> ESCs.

a Cartoon depicting the gRNA target sites at exon 4 of mouse Adnp gene. b Genotyping showing the mutant alleles. c Western blot analysis of ADNP levels in control, shRNA knockdown, and Adnp−/− ESCs. d Representative image showing morphology of control and early passaged Adnp−/− ESCs. e The mRNA expression of representative pluripotency-related, mesodermal, neuroectodermal, endodermal genes in control, and early passaged Adnp−/− ESCs (n = 3 per group). f Representative image showing morphology of embryoid bodies (EBs) at indicated time points. g Heat-map analysis of DEGs of the indicated lineage-specific genes for control and Adnp−/− ESC-derived day 6 EBs, based on three RNA-seq replicates. h qPCR analysis showing the dynamic expression of the indicated genes during EB formation of control and Adnp−/− ESCs. qRT-PCR was based on three biologically independent experiments (n = 3 per group). Data are presented as mean values ± SEM in (e, h). p values by two-tailed unpaired t-test are shown in (e, h). ns: not significant. Source data are provided as a Source Data file. Experiments were repeated at least two times in (c, d, f), and similar results were obtained.

ADNP is required for proper ESC neural differentiation.

a Cartoon showing the two-Stage ESC neural differentiation protocol. b Representative image showing morphology of day 6 and day 20 control and Adnp−/− ESC-derived neurospheres and neuronal cultures from three independent experiments with similar results. The white arrows pointing to the fiber-like neuronal structures. c The dynamic expression profile of representative neuroectodermal genes during control and Adnp−/− ESC neural induction. d Flow cytometry analysis for quantification of PAX6+ cells. Blue: isotype control; purple: experimental group using PAX6 antibody. e IF staining of neural progenitor marker NESTIN and ADNP for control, Adnp−/− ESC and FLAG-ADNP restoring Adnp−/− ESC-derived day 6 NPCs. Representative image from 3 to 5 random microscopic fields of three independent experiments with similar results. f Quantification of mean fluorescence intensity of NESTIN staining using ImageJ software. FLAG-ADNP rescued the fluorescence intensity of NESTIN staining in Adnp−/− ESC-derived neurospheres. g qRT-PCR analysis for Tubb3 (encoding TuJ1) and Gfap for day 19 control and Adnp−/− ESC-derived neuronal cell cultures (n = 3 per group). h IF staining of neuronal marker TuJ1 and glial marker GFAP for day 19 control and Adnp−/− ESC-derived neuronal cell cultures. The white arrows showing the neuronal fiber structures. i Quantification of mean fluorescence intensity of TuJ1 and GFAP staining using ImageJ for panel (h). j WB analysis of TuJ1 and GFAP levels in day 19 control and Adnp−/− ESC-derived neuronal cell types. WB were repeated at least two times, and shown were the representative data. qRT-PCR was based on three biologically independent experiments in (c, g). Mean fluorescence intensity was calculated based on three biologically independent experiments (n = 3–5 different regions of interest per group) in (f, i). Data are presented as mean values ± SEM and p values by two-tailed unpaired t-test are shown in (c, f, g, i).

ADNP promotes the expression of neuroectoderm developmental genes.

a Schematic representation of the design for RNA-seq experiments; b plot showing DEGs from day 3 and day 6 control and Adnp−/− ESC-derived neurospheres; RNA-seq for each time points were repeated at least two times. DEGs were defined by FDR < 0.05 and a Log2 fold change > 1. The numbers of upregulated and downregulated genes were shown as average. c Heat map illustrating the expression of selected neuroectoderm and pluripotency-related genes that were shown as log2 FPKM in day 6 control and Adnp−/− ESC-derived neurospheres. Each lane corresponds to an independent biological RNA-seq sample. d Representative morphology of day 6 Adnp−/− ESC-derived neurospheres after addition of Tet-Express proteins from the indicated time points. Tet stands for Tet-Express. Experiments were repeated two times, and similar results were obtained. e IF staining of PAX6 for day 6 Adnp−/− ESC-derived neurospheres after addition of Tet-Express proteins at the indicated time points. Experiments were repeated three times, and similar results were obtained. f Quantification of mean fluorescence intensity of PAX6 staining using ImageJ for panel (e), based on three biologically independent experiments (n = 3–5 different regions of interest per group). Data are presented as mean values ± SEM and p values by two-tailed unpaired t-test are shown. ns not significant. Source data are provided as a Source Data file.

Wnt signaling is impaired in the absence of ADNP.

a Dissection of KEGG data of DEGs from day 3 and day 6 control and Adnp−/− ESC-derived neurospheres, showing enrichment of the Wnt signaling pathway. Results are shown as −log10 (p value). b Heat map illustrating the expression of selected Wnt-related genes that were shown as log2 FPKM in day 6 control and Adnp−/− ESC-derived neurospheres. Each lane corresponds to an independent biological RNA-seq sample. c qRT-PCR analysis for the indicated Wnt target genes for day 3 and day 9 control and Adnp−/− ESC-derived neurospheres. qRT-PCR was based on three biologically independent experiments (n = 3 per group). d TopFlash luciferase activity assay for lysates from day 3 control and Adnp−/− ESC-derived neurospheres, in the absence or presence of Wnt3a. Data are based on two biologically independent experiments, and similar results were obtained. e Rescue of the expression of the indicated neural developmental genes and putative Wnt target genes by addition of CHIR and Wnt3a, or by restoring 3×FLAG-ADNP. Data are based on three biologically independent experiments, and similar results were obtained. Genes in black dashed box are representative neurodevelopmental genes, and genes in green dashed box are representative Wnt target genes. f Rescue of NESTIN expression by addition of CHIR. Shown is the representative IF staining of NESTIN for day 6 control and Adnp−/− ESC-derived neurospheres (n = 3 per group). g Quantification of mean fluorescence intensity of NESTIN staining using ImageJ for panel (f) based on three biologically independent experiments (n = 3–5 different regions of interest per group). Data are presented as mean values ± SEM, and p values by two-tailed unpaired t-test are shown in (c, d, e, g). Source data are provided as a Source Data file for (c, d, e).

Identifying β-catenin as an ADNP interacting protein.

a Schematic representation showing the experimental design of IP in combination mass spectrometry assay (left) and a list of representative ADNP interacting proteins (right). b Co-IP data for endogenous ADNP and β-catenin in ESCs. Up: IP ADNP followed by WB β-catenin; bottom: IP β-catenin followed by WB ADNP. c Co-IP data for endogenous ADNP and β-catenin of day 3 ESC-derived neurospheres. d Co-IP data for FLAG-ADNP and β-catenin in 3×FLAG-ADNP overexpressing Adnp−/− ESCs. e Schematic representation of the full-length and the truncated ADNP mutants. f IP of FLAG-ADNP-Nter (1–685) and Myc-β-catenin in HEK293T cells. g IP of in vitro synthesized HA-β-catenin and FLAG-ADNP. h Co-IP of FLAG-ADNP-NAP and HA-β-catenin in HEK293T cells. i Schematic representation of the full-length and the truncated β-catenin mutants. j Co-IP of FLAG-β-catenin (151–666) and ADNP in HEK293T cells. k Co-localization of ADNP and β-catenin in day 19 ESC-derived neuronal cell cultures. All WB and IF experiments were repeated at least two times. Similar results were obtained and shown are the representative images.

ADNP stabilizes β-catenin during ESC neural differentiation.

a WB showing total β-catenin levels in day 3 control and Adnp−/− ESC-derived neurospheres. b WB showing β-catenin levels in the cytoplasmic and the nuclear fraction of lysates from day 3 control and Adnp−/− ESC-derived neurospheres. Note that β-catenin levels were significantly reduced in the cytoplasmic but slightly reduced in the nuclear fraction of lysates. c Time course WB assay showing total and phosphorylated β-catenin levels during control and mutant ESC differentiation toward a neural fate. d Representative image of IF staining of β-catenin in day 19 ESC-derived neuronal cultures; e restoring FLAG-ADNP in mutant ESCs could rescue the β-catenin levels in day 6 neurospheres. f Representative WB showing β-catenin levels in the combination treatment of CHIR and MG132. g Representative WB showing the ubiquitylation levels of β-catenin in control and Adnp−/− ESCs. h Representative WB showing that total β-catenin levels were slightly elevated and p-β-catenin levels were slightly reduced in day 3 neurospheres from FLAG-ADNP overexpressing ESCs. i Representative WB showing the expression of the indicated proteins in HEK293T cells that were transfected with an increasing dose of ADNP. WB and IF staining experiments have been repeated at least two times and similar results were obtained.

ADNP stabilizes β-catenin by preventing the formation of degradation complex.

a Cartoon showing the armadillo domain of β-catenin. Arm1 contains armadillo repeats 1–4 and Arm2 contains repeats 5–9. Known core binding armadillo repeats of β-catenin for Axin and APC interaction were indicated with red and green bars, respectively. b IP experiment showing that the Arm1 fragment can interact with ADNP in HEK293T cells. c IP experiment showing that the Arm2 fragment can interact with ADNP in HEK293T cells. d The relationship between ADNP–β-catenin and β-catenin–Axin interactions was examined by performing competitive protein-binding assay. An increasing dose of plasmids encoding FLAG-ADNP and plasmids encoding MYC-AXIN1 and HA-β-catenin was co-transfected into HEK293T cells. Lysates were extracted from the transfected cells and pull-downed by HA antibody followed by WB using MYC and HA antibodies. WB showing that the amount of Axin co-immunoprecipitated with β-catenin became reduced by the increased addition of ADNP. e The competitive protein-binding assay showing that the amount of APC co-immunoprecipitated with β-catenin became reduced by the increased addition of ADNP. f WB showing the expression levels of HA-β-catenin by the addition of Tet-Express protein in the inducible HA-β-catenin Adnp−/− ESCs. g IF staining showing the rescue of TuJ1 levels in day 19 Adnp−/− ESC-derived neuronal cell cultures by adding Tet-Express transactivator daily at early stage of neural induction. h Quantification of mean fluorescence intensity of TuJ1 staining using ImageJ for panel (g), based on three biologically independent experiments (n = 3–5 different regions of interest per group). Data are presented as mean values ± SEM and p values by two-tailed unpaired t-test are shown. i The representative morphology of day 6 neurospheres derived from control, Adnp−/− ESCs, Adnp−/− ESCs treated with CHIR, as well as FLAG-ADNP and HA-β-catenin restoring Adnp−/− ESCs, and the rescue experiments were repeated two times. The WB and IP experiments have been repeated two times and similar results were obtained.

Loss of <italic>adnp</italic> leads to the defective neural development in zebrafish embryos.

a CRISPR/Cas9 gRNA design and the genotyping result of the adnpa mutant allele. b gRNA design and the genotyping result of adnpb mutant allele; c representative morphology of 2 dpf control and adnpa adnpa double mutants. Black arrow showing the obvious cell death (black area) in head region of mutant embryos. d 3D Z-stack image showing the reduced expression of HuC/D in brain of 36 hpf control and double mutant zebrafish embryos. Arrows show the distance between the convex tip of the eye cups. e GFP fluorescence signal showing the reduced elavl3-GFP levels in adnpa adnpb deficient embryos. f Whole-mount in situ hybridization (WISH) images for the indicated neural markers for 2 dpf control and double mutant embryos. g WISH images for the indicated neural markers for 13 hpf control and double mutant embryos. h WISH images for the indicated neural markers for 24 hpf control and double mutant embryos. Black arrows pointing to where expression levels were reduced. All experiments were repeated at least two times, and similar results were obtained. Scale bars: 200 μm in (c), 100 μm in (dh).

Loss of <italic>adnp</italic> leads to reduced β-catenin levels and Wnt signaling in zebrafish embryos.

a IF staining of FLAG and β-catenin showing the co-localization of FLAG-Adnpa and β-catenin in 3.5 hpf adnpa−/− adnpb−/− embryos injected with mRNAs encoding FLAG-Adnpa. FLAG-Adnpa is predominantly expressed in the nucleus. b IF staining of FLAG and β-catenin showing the co-localization of FLAG-Adnpa and β-catenin in 6 hpf adnpa−/− adnpb−/− embryos injected with mRNAs encoding FLAG-Adnpa. FLAG-Adnpa is predominantly expressed in the nucleus. c Co-IP data showing FLAG-Adnpa interact with β-catenin in 24 hpf adnpa−/− adnpb−/− embryos injected with mRNAs encoding FLAG-Adnpa. d IF staining of β-catenin and HuC showing slightly reduced HuC and β-catenin levels in 16 hpf adnpa−/− adnpb−/− (adnpab−/−) embryos. e IF staining of β-catenin and HuC showing significantly reduced HuC and β-catenin levels in 24 hpf adnpa−/− adnpb−/− embryos. f WB data showing slightly reduced β-catenin levels in 24 hpf adnpa−/− adnpb−/− embryos. g TopFlash luciferase activity assay for total lysates made from 24 hpf control, double mutant embryos and double mutant embryos injected with adnpa mRNAs. Three pools of ten embryos each (n = 3 per group) were lysed with the passive lysis buffer and assayed for luciferase activity. Data are based on two biologically independent experiments, and similar results were obtained. h Representative morphology of 2 dpf adnpa overexpressing embryos. The dorsalized phenotypes (C1–C4) were according to the DV patterning index38. All experiments were repeated at least two times, and similar results were obtained. Shown are representative images. Scale bars: 50 μm in (a, b, d), 100 μm in (e), and 200 μm in (h).

ZFIN is incorporating published figure images and captions as part of an ongoing project. Figures from some publications have not yet been curated, or are not available for display because of copyright restrictions.

Acknowledgments
This image is the copyrighted work of the attributed author or publisher, and ZFIN has permission only to display this image to its users. Additional permissions should be obtained from the applicable author or publisher of the image. Full text @ Nat. Commun.