FIGURE SUMMARY
Title

Efficient targeted integration directed by short homology in zebrafish and mammalian cells

Authors
Wierson, W.A., Welker, J.M., Almeida, M.P., Mann, C.M., Webster, D.A., Torrie, M.E., Weiss, T.J., Kambakam, S., Vollbrecht, M.K., Lan, M., McKeighan, K.C., Levey, J., Ming, Z., Wehmeier, A., Mikelson, C.S., Haltom, J.A., Kwan, K.M., Chien, C.B., Balciunas, D., Ekker, S.C., Clark, K.J., Webber, B.R., Moriarity, B.S., Solin, S.L., Carlson, D.F., Dobbs, D.L., McGrail, M., Essner, J.
Source
Full text @ Elife

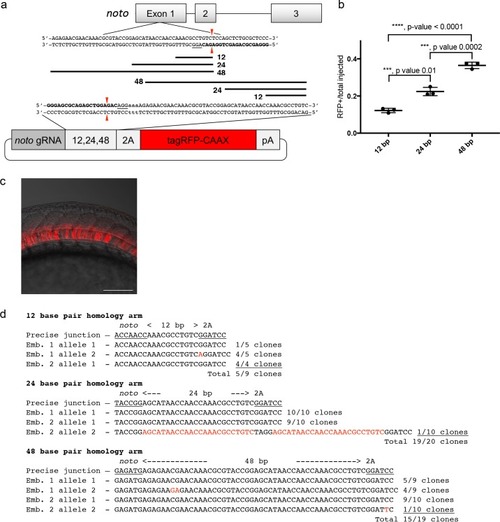
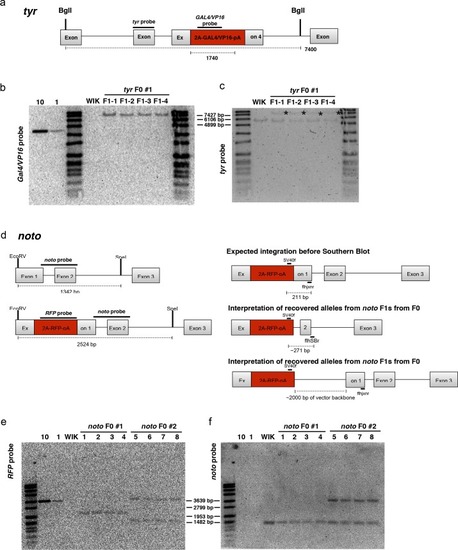
A single short homology arm 5’ to the sgRNA target site in the noto gene targets integration in zebrafish embryos. (a) Schematic for noto homology arm and donor vector design. Bold letters show the noto sgRNA target sequence in the genome. This sgRNA target sequence was also used to target Cas9 cutting in the donor vector. Black bars represent the different homology arm lengths 12, 24, or 48 bp, used to target the 2A-tagRFP-CAAX donor vector into the noto exon 1 target site. PAM sequences are underlined. Red arrows indicate the Cas9 cut site 3 bp upstream of the PAM. The 3 nucleotide spacer lacking homology to the genome is represented by the lowercase sequence ‘aaa’ located in between the donor vector PAM and the 5’ end of the homology arm. (b) Targeting efficiency of noto exon1 2A-tagRFP-CAAX donor vectors containing a single 5’ homology arm of 12, 24, or 48 bp. Data represents mean +/- s.e.m. of 3 independent targeting experiments. p values calculated using two-tailed unpaired t-test. (c) Live confocal image of noto-2A-TagRFP-CAAX-SV40 targeted embryo showing specific RFP expression in the notochord. Scale bar, 100 μm. (d) Sanger sequencing of cloned 5’ junction fragments from RFP positive F0 embryos, aligned to the expected sequence from a precise integration event. Numerator represents correct clones, denominator represents total clones sequenced. Junctions are considered precise if the homology arm does not contain any mismatch and there are no insertions or deletions up- or downstream of the programmed homology.

The Universal sgRNA (UgRNA) promotes high efficiency targeted integration.

(a) Universal sgRNA (UgRNA) sequence. Cas9 PAM underlined. (b) Schematic of targeting using the UgRNA to direct CRISPR/Cas cutting in the donor vector. The genomic sgRNA target site sequence in noto exon 2 is shown in bold green. The sequence of the UgRNA in the donor vector is shown in bold black. PAM sequences are underlined, and Cas9 cut sites are indicated with red arrow. The 24 bp noto homology arm in the donor vector is in green; since it lacks the last 3 base pairs and PAM sequence found at the genomic noto target site it is not recognized by the noto sgRNA. (c) Frequency of injected embryos displaying RFP expression in the notochord compared to total number of injected embryos following targeting using the noto sgRNA, UgRNA, and UgRNA-24bp-2A-tagRFP-CAAX vector shown in (b).

GeneWeld strategy and pGTag vector series.

(a) GeneWeld reagent components are designed for simultaneous nuclease targeting of genome and donor to reveal short regions of homology. Red arrowheads represent nuclease DSB cut sites. Components include: 1 - Designer nuclease mRNA, either Cas9 to target both the genome and donor, or Cas9 to target the donor and TALEN to cut the genome; 2 - sgRNA for targeting Cas9 to genome; 3 - Universal sgRNA to liberate donor cargo and homologous ends; and 4 - pGTag donor of interest with short homology arms. (b) Stippled and striped boxes represent sticky ends created by Type IIs restriction endonucleases BfuAI and BspQI, allowing digestion and ligation of both homology arms into the donor vector in a single reaction. Homology arm fragments are formed by annealing complementary oligonucleotides to form dsDNA with sticky ends for directional cloning into the vector. XFP = Green or Red Fluorescent Protein. pA = SV40 or β-actin 3’ untranslated region. Red and green fluorescent proteins were cloned into the pGTag vectors, and for each color, subcellular localization sequences for either nuclear localization (NLSs) and membrane localization (CAAX) are provided. (c) Schematic of GeneWeld targeting in vivo. After designer nuclease creates targeted double-strand breaks in the genome and donor, end resection likely precedes homology recognition and strand annealing, leading to integration of the donor without vector backbone.

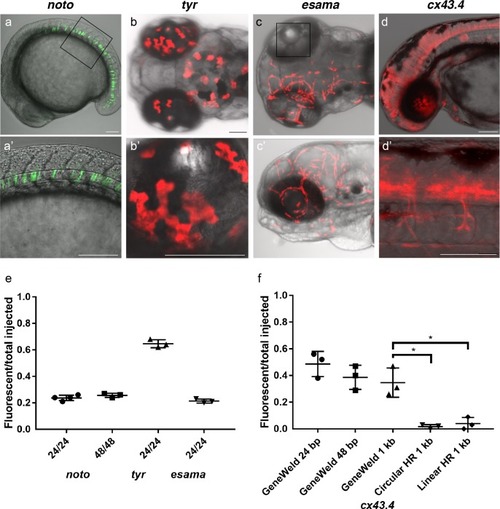
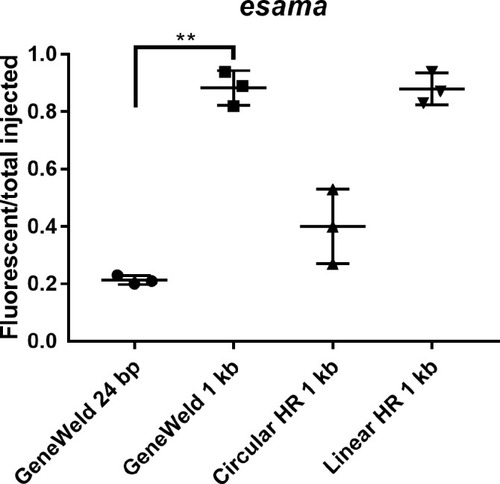
(a–d) Live confocal images of F0 injected embryos showing fluorescent reporter expression after GeneWeld targeted integration. (a, a’) Mid somite stage embryo targeted at noto with 2A-eGFP. (b, b’) 5 days post fertilization (dpf) Tg(UAS:mRFP)tpl2 embryo targeted at tyr with 2A-Gal4/VP16. (c) 2 dpf and (c’) 3dpf Tg(UAS:mRFP)tpl2 embryo targeted at esama with −2A-Gal4/VP16. (d, d’) 31 hr post fertilization embryo targeted at cx43.4 with 2A-tagRFP-CAAX. (e) Fraction of embryos with reporter gene expression following GeneWeld targeting at noto, tyr and esama. 5’ and 3’ homology lengths flanking donor cargos indicated in base pairs as 24/24 or 48/48. (f) Comparison of the fraction of RFP expressing embryos after targeting cx43.4 exon 2 using GeneWeld 24/24 bp homology, GeneWeld 48/48 bp homology, Geneweld 1 kb/1 kb homology, Circular HR 1 kb/1 kb (injection did not include UgRNA, *p=0.0067), Linear HR 1 kb/1 kb (donor was digested and the linear DNA fragment containing the homology arm targeting construct was gel purified before injection, *p=0.0111). Data represents mean +/- s.e.m. of 3 independent targeting experiments. p values calculated using Students t test. Scale bars, 100 μm.

Integration of a 2A-tagRFP reporter gene into <italic>tyr.</italic>

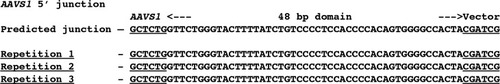
PCR amplification and sequence of 5’ junction fragments between tyr exon 4 and the targeted 2A-tagRFP-CAAX-Sv40 vector from randomly selected RFP-negative F0 injected embryos. 5/6 RFP-negative F0 injected embryos contain the expected 5’ junction fragment (marked with an ‘*’). The junction fragments from embryos F0-1 and −2 were TA-cloned and sequenced. 3 out of 4 cloned PCR products from embryo F0-1 and 3 out of 3 cloned products from embryo 2 showed precise 5’ integration in tyr. 1 of the 4 embryos from F0-1 contained a single nucleotide polymorphism in the 2A peptide sequence (shown in red).

Comparison of targeted integration efficiency at <italic>esama</italic> using short vs long homology arms and GeneWeld vs. in vitro linearized donor template.

Comparison of the frequency of RFP expressing injected embryos after targeting esama exon two using GeneWeld 24/24 bp homology arms, Geneweld 1 kb/1 kb homology arms, Circular HR 1 kb/1 kb homology arms (injection did not include UgRNA), and Linear HR 1 kb/1 kb homology arms (donor was digested and the linear DNA fragment containing the homology arm targeting construct was gel purified before injection). Increasing the length of the homology arm to 1 kb significantly increased the frequency of RFP expressing embryos using GeneWeld (p=0.0001), Circular, or Linear template. Data represents mean +/- s.e.m. of 3 independent targeting experiments. p value calculated using Students t test.

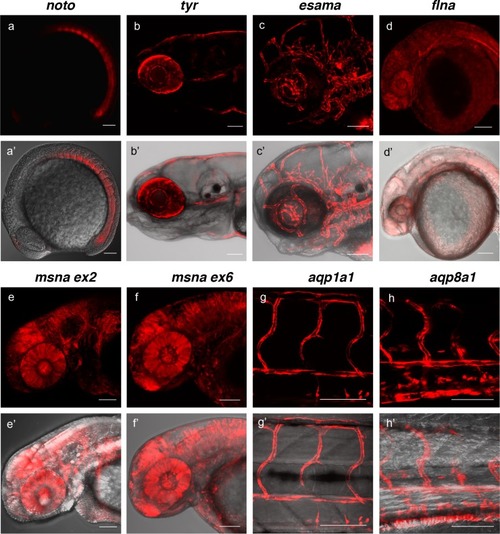
(a, a’) Tg(noto-2A-TagRFP) embryo at mid somite stage showing expression in the notochord and floor plate. (b, b’) Tg(tyr-2A-Gal4/VP16); Tg(UAS:mRFP)tpl25 dpf larva displaying expression in the melanocytes. (c, c’) Tg(esama-2A-Gal4/VP16); Tg(UAS:mRFP)tpl24 dpf larva showing expression in the vascular system. (d, d’) Tg(flna-2A-Gal4/VP16); Tg(UAS:mRFP)tpl21 dpf embryo showing widespread expression. (e, e’ and f, f’) Exon 2 and exon 6 msna targeted Tg(msna-2A-Gal4/VP16); Tg(UAS:mRFP)tpl2 2dpf embryos showed expression in the central nervous system and vasculature. (g, g’ and h, h’) Tg(aqp1a1-2A-Gal4/VP16; Tg(UAS:mRFP)tpl2) and Tg(aqp8a1-2A-Gal4/VP16); Tg(UAS:mRFP)tpl22 dpf embryos display RFP expression in the trunk and tail vasculature. Scale bars, 100 μm.

Molecular analysis of F1 GeneWeld GTag targeted alleles at <italic>tyr</italic> and <italic>noto.</italic>

(a–c) Molecular analysis of Tg(tyr-2A-GAL4/VP16) F1 offspring from a single targeted F0 founder. (a) Schematic of expected integration pattern for tyr targeted with pGTag-2A-GAL4/VP16. 148 bp tyr probe in Exon 3 and 583 bp probe in GAL4/VP16 are indicated. (b) GAL4/VP16 and (c) tyr probed Southern blots of genomic DNA from wild type (WIK) and 4 individual GAL4/VP16 positive F1s. The expected 7400 bp band is detected with both probes, suggesting a single copy integration. (d–f) Tg(noto-2A-RFP) F1 targeted integration alleles from 2 independent F0 founders. (d) noto gene model with location of restriction enzymes used for genomic Southern blot analysis. Location of the 513 bp noto probe is indicated (dark lines). The predicted and an interpretation of the recovered alleles are shown. (e) Southern blots of F1 Tg(noto-2A-RFP) individuals hybridized with RFP probe. F1 from founder F0#1 contain a ~ 2100 bp band corresponding to integration plus deletion of ~400 bp in noto. F1 progeny from founder F0#2 show two bands: a ~ 3700 bp band corresponding to integration of the reporter plus 2000 bp of vector backbone, and a ~ 1500 bp band which may represent an off-target integration. Loading controls (10, 1) correspond to 10 copies or 1 copy of RFP containing plasmid. WIK, wild type control DNA. (f) Southern blot in (e) stripped and re-hybridized with the noto-specific probe. A 1342 bp band representing the wild type allele was detected in all individuals. The integration allele in F1s from F0 #1 was not detected due to deletion of the region containing the probe. F1s from F0 #2 contain the ~3700 bp band corresponding to the noto-2A-RFP integration allele.

Sequence of PCR junction fragments amplified from genomic DNA from F1 transgenic zebrafish adults generated by GeneWeld short homology directed targeted integration.

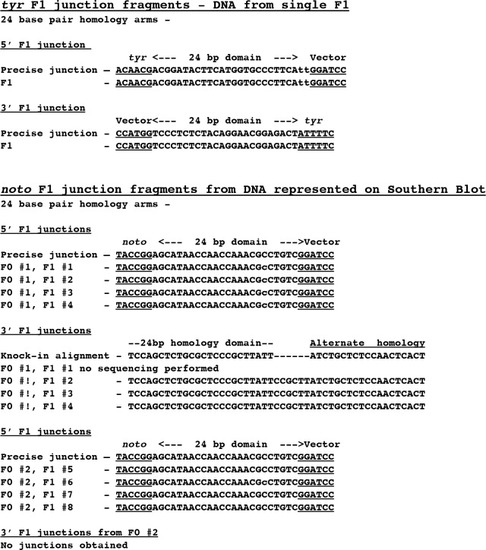
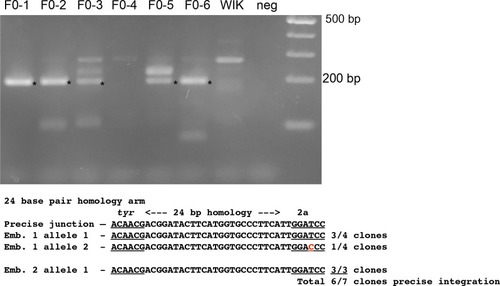
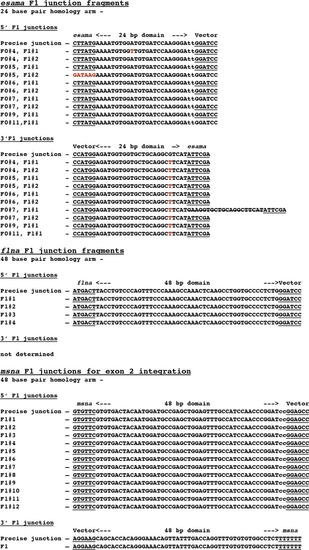
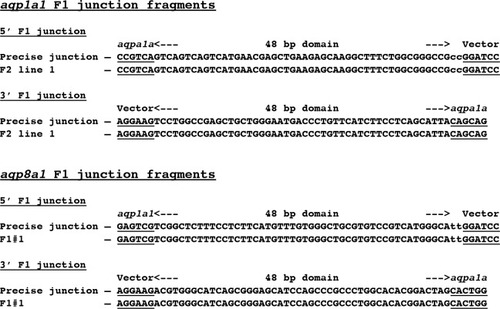
Precise integration at the 5’ and 3’ ends in F1 progeny from F0 founder fish targeted at tyr, esama, flna, msna, aqp1a1, and aqp8a1. noto F1 progeny from founder #1 had a precise 5’ junction and imprecise 3’ junction. noto F1 progeny from founder #2 had a 5’ precise junction; no 3’ junction was amplified by PCR. Lowercase letters represent ‘padding’ nucleotides to place the integrated GTag cassette in frame with the targeted gene. Red letters represent mismatches unless otherwise noted below. esama F1 3’ junctions contain a single nucleotide variant shown in red. One esama F1 3’ junction included a 20 bp insertion (strike-through).

Sequence of PCR junction fragments amplified from genomic DNA from F1 transgenic zebrafish adults generated by GeneWeld short homology directed targeted integration.

esama, flna, and msna. esama F1 3’ junctions contain a single nucleotide variant shown in red. One esama F1 3’ junction included a 20 bp insertion (strike-through). Lowercase letters represent “padding” nucleotides to place the integrated GTag cassette in frame with the targeted gene. Red letters represent mismatches unless otherwise noted below.

Sequence of PCR junction fragments amplified from genomic DNA from F1 transgenic zebrafish adults generated by GeneWeld short homology directed targeted integration.

aqp1a1 and aqp8a1. Lowercase letters represent “padding” nucleotides to place the integrated GTag cassette in frame with the targeted gene.

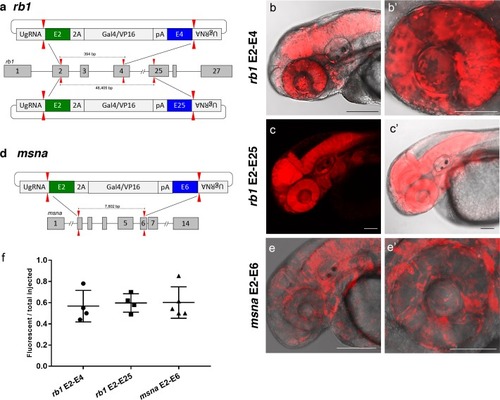
(a) Schematic for Gal4/VP16 reporter integration to tag a deletion allele of rb1 exons 2–4 (top) and rb1 exons 2–25 (bottom). Arrowheads designate CRISPR/Cas9 DSBs. CRISPR sgRNAs in two exons are expected to excise the intervening genomic DNA. The targeting vector contains a 5’ homology arm flanking the upstream exon target site and a 3’ homology arm flanking the downstream exon target site. (b, b’) Live confocal image of F0 Tg(UAS:mRFP)tpl2 embryo after 2A-Gal4/VP16 deletion tagging at rb1 exons 2–4. (c, c’) Live confocal image of F1 Tg(rb1-e2-2A-Gal4/VP16) embryo from a founder targeted at rb1 exons 2–25. A deletion from exon 2–25 was not observed in the F1 generation, but the 5’ junction was in frame. (d) Schematic for 2A-Gal4/VP16 deletion tagging of msna exons 2–6. (e, e’) Live confocal image of F0 Tg(UAS:mRFP)tpl2 embryo after 2A-Gal4/VP16 deletion tagging at msna exons 2–6. (f) Somatic reporter efficiency of targeted deletion tagging using 48 bp homology arms for rb1 exons 2–4, rb1 exons 2–25, and msna exons 2–6. Data represents mean +/- s.e.m. of 4 (rb1) and 5 (msna) independent targeting experiments. Scale bars 200 μm (b, c, c’, e); 100 μm (b’, e’).

Sequences of 5’ and 3’ junction fragments from <italic>rb1</italic> exon 2–4, <italic>rb1</italic> exon 2–25, and <italic>msna</italic> exon 2–6 deletion tagged alleles in F0 injected embryos.

Detection of precise and imprecise 5’ and 3’ junction fragments in somatic tissue of F0 embryos injected with two guides that target two exons and a pGTag-Gal4/VP16 donor with 5’ and 3’ homology arms corresponding to the 5’ exon and 3’ exon target sites. Cloned PCR amplicons were sequenced from 3 individual embryos for each targeted deletion tagging experiment.

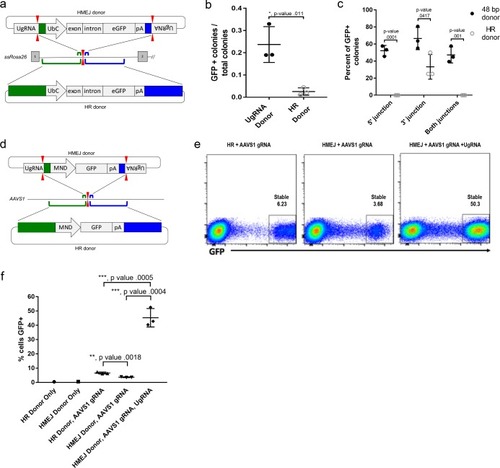
(a) Strategy for integration using HMEJ and HR donors into intron 1 of S. scrofa ROSA26 locus. Arrowheads CRISPR/Cas9 (for HMEJ donor) and TALEN (genome) DSBs. (b) Targeting efficiency of the HMEJ donor vs the HR donor as reported by GFP positive colonies out of total colonies. (c) Percent of GFP positive colonies analyzed containing properly sized junction fragments, comparing HMEJ and HR donors. Data are from three independently targeted cell populations. Data represents mean +/- s.e.m. of 3 independent targeting experiments. (d) Diagram of HR and HMEJ strategies for targeted integration of a MND:GFP reporter cassette into the human AAVS1 locus. (e) Flow cytometry analysis of GFP expression 14 days post-electroporation for each targeting modality: HR (left), HMEJ without universal sgRNA (middle), and HMEJ with universal sgRNA (right). Stable gate was drawn to measure the uniformly expressing population formed by targeted integration and was set based on episome only controls. (f) Quantification of stable GFP expressing population as measured by flow cytometry at day 14. Data are from three independently targeted cell populations. Data represents mean +/- s.e.m. of 3 independent targeting experiments. p values calculated using two-tailed unpaired t-test.

HMEJ-mediated targeted integration of an MND:GFP reporter at the <italic>AAVS1</italic> locus in human K-562 cells.

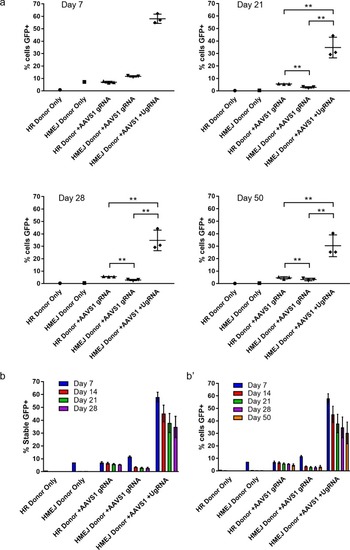
FACs sorted percent of GFP+ cells out of total K-562 cells at day 7, 21, 28, and 50. (b) Summary data for percent of stable GFP+ K-562 cells from day 7, 14, 21, and 28. (b’) Summary data for percent of total cells GFP+ from day 7, 14, 21, 28, and 50. Data represents mean +/- s.e.m. of 3 independent targeting experiments. p values calculated using two-tailed unpaired t-test.

Direct sequencing of 5’ junction PCR products derived from three independently targeted bulk cell populations.

(a) Direct sequencing of 5’ junction PCR products derived from three independently targeted bulk cell populations. 48 bp HMEJ homology region and remainder of genomic AAVS1 sgRNA are indicated. Genomic sequence is directly left of the 48 bp HMEJ region and vector sequence is directly to the right of the AAVS1 sgRNA cut site.

Acknowledgments
This image is the copyrighted work of the attributed author or publisher, and ZFIN has permission only to display this image to its users. Additional permissions should be obtained from the applicable author or publisher of the image. Full text @ Elife