
- Title
-
Neuronal activity disrupts myelinated axon integrity in the absence of NKCC1b
- Authors
- Marshall-Phelps, K.L.H., Kegel, L., Baraban, M., Ruhwedel, T., Almeida, R.G., Rubio-Brotons, M., Klingseisen, A., Benito-Kwiecinski, S.K., Early, J.J., Bin, J.M., Suminaite, D., Livesey, M.R., Möbius, W., Poole, R.J., Lyons, D.A.
- Source
- Full text @ J. Cell Biol.

ue58 mutant zebrafish have a severe, peripheral nerve myelin pathology. (A) Confocal images of the spinal cord of Tg(mbp:EGFP-CAAX) control (left) and ue58 mutant (right) at 7 dpf showing disruption to CNS myelin (region within brackets). Scale bar, 10 µm. (B) Confocal images of the pLLn in Tg(mbp:EGFP-CAAX) control (top) and ue58 mutant (bottom) animals at 5 dpf showing major disruption to myelin. Scale bar, 10 µm. (C) Higher magnification images of areas demarcated in B showing myelin in control (left) and ue58 mutant (right) animals. Scale bar, 10 µm. (D) DIC images of Tg(mbp:EGFP-CAAX) control (left) and ue58 mutants (right) at 6 dpf showing appearance of tissue edema. Scale bar, 10 µm. (E) Brightfield images of control (left) and ue58 mutants (right) at 6 dpf showing generally normal morphological development. Scale bar, 0.5 mm. (F) Genomic structure of the zebrafish slc12a2b gene, showing exons (boxes) and introns (lines). White boxes denote untranslated regions. Exons in black were annotated in partial genomic sequences LOC100537771 and LOC100329477 and matched homologous exons in the orthologue slc12a2a. Exons in blue did not align with any annotated genomic sequence, and their limits were inferred by homology with slc12a2a genomic structure. Exons are drawn to scale relative to each other; introns in pink contain unknown bases (N) and are of unknown size. The start (ATG) and stop (TGA) codons are indicated in green and red, respectively. The ue58 allele has a T>A mutation in exon 26 leading to a premature stop codon. (G) Alignment of the 40 most C-terminal amino acids of NKCC1b shows high similarity between species in this domain. Arrowhead indicates the position of the premature stop codon introduced by ue58. (H) Protein structural prediction algorithms, using CCTOP, indicate that NKCC1b in zebrafish is likely to have intracellular N and C termini and 12 transmembrane domains. (I) Sequence similarities of the protein products of zebrafish NKCC1a, NKCC1b, and murine and human NKCC1 homologues. |
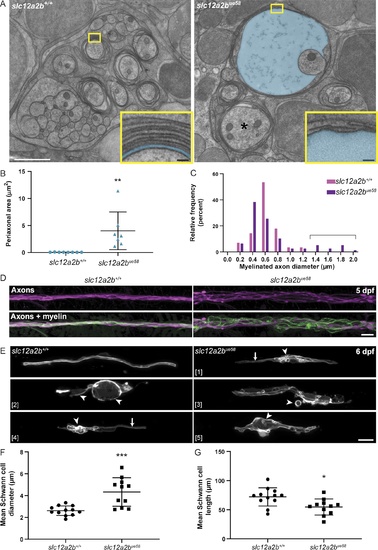
Disruption to NKCC1b leads to swelling of the periaxonal space, dysmyelination, and axonal disorganization. (A) Electron micrographs of high-pressure–frozen pLLn in control (left) and slc12a2bue58 mutant (right) at 5 dpf. slc12a2bue58 mutants show significant enlargement of the periaxonal space, highlighted in blue and enlarged axons (asterisk). Insets show a higher magnification to highlight the periaxonal space in controls and slc12a2bue58 mutants. White scale bar, 1 µm. Black scale bars, 50 nm. (B) Quantification of periaxonal area in control and slc12a2bue58 mutants (control 0.05 ± 0.02 µm2 vs. slc12a2bue58 4 ± 3.5 µm2, P = 0.0065). Error bars represent mean ± SD. A two-tailed Student’s t test was used to assess statistical significance. Each point represents an individual myelinated axon from three control and five slc12a2bue58 mutant animals. **, P < 0.01. (C) Quantification of the diameter of myelinated axons in control and slc12a2bue58 mutants. Bracket indicates axons in the mutant with greater than normal diameter. (D) Confocal images of live Tg(cntn1b:mCherry), Tg(mbp:EGFP-CAAX) double-transgenic control (left) and slc12a2bue58 mutant (right) animals at 5 dpf indicates axonal defasciculation and derangement of myelin. Scale bar, 10 µm. (E) Confocal images of individual mosaically labeled Schwann cells in control (top left panel) and slc12a2bue58 mutants (panels 1–5) highlighting the variable morphological manifestation of the mutant phenotype. Scale bar, 10 µm. Arrows point to regions of normal appearing myelin and arrowheads to dysmyelination. (F) Quantitation of mean Schwann cell diameter in maximum intensity projection images of single Schwann cells at 6 dpf (control 2.6 ± 0.4 µm vs. slc12a2bue58 4.3 ± 1.3 µm, P = 0.0003). Error bars represent mean ± SD. A two-tailed Student’s t test was used to assess statistical significance. Each point represents a single cell from 11 control and 10 slc12a2bue58 mutant animals. Scale bar, 10 µm. ***, P < 0.001. (G) Quantitation of mean Schwann cell length in maximum intensity projection images of single Schwann cells at 6 dpf (control 72.1 ± 15.7 µm vs. slc12a2bue58 54.7 ± 13.8 µm, P = 0.011). Error bars represent mean ± SD. A two-tailed Student’s t test was used to assess statistical significance. Each point represents a single cell from 11 control and 10 slc12a2bue58 mutant animals. *, P < 0.05. |
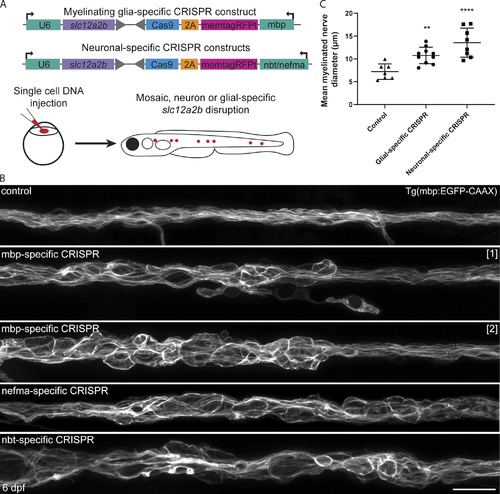
Cell-type–specific disruption of slc12a2b in either neurons or Schwann cells leads to myelin pathology. (A) Schematic overviews of constructs used to induce slc12a2b mutations in myelinating glial cells (top) and neurons (bottom), which are separately injected into embryos at the single-cell stage, leading to mosaic expression (red dots) at later stages, when myelination is examined. (B) Confocal images of Schwann cells along the pLLn in a 6 dpf Tg(mbp:EGFP-CAAX) control (top), two genetically mosaic animals in which slc12a2b has been targeted in myelinating glial cells, and two further mosaic animals in which slc12a2b has been targeted in neurons. Scale bar, 20 µm. (C) Quantitation of mean myelinated nerve diameter in controls compared with larvae with glial- or neuronal-specific slc12a2b-specific disruption at 6 dpf (control 7.2 ± 1.7 µm vs. glial-specific slc12a2b disruption 10.7 ± 1.8 µm vs. neuronal-specific slc12a2b disruption 13.6 ± 3.2 µm). Error bars represent mean ± SD. One-way ANOVA followed by Tukey’s multiple comparison test was used to assess statistical significance (ANOVA F(2,22) = 14.09, P = 0.0001). Each point represents an individual animal. **, P < 0.01; ****, P < 0.0001. |

Neuronal activity drives peripheral nerve pathology in slc12a2b mutants. (A) Schematic overview of when, where and for how long TTX was applied to slc12a2bue58 mutants. (B) Confocal images of a Tg(mbp:EGFP-CAAX) control (top), slc12a2bue58 mutant (middle), and slc12a2bue58 mutant injected with TTX (bottom). Scale bar, 20 µm. (C) Quantitation of mean myelinated nerve diameter in controls, slc12a2bue58 mutants and slc12a2bue58 mutants injected with TTX (control 7.1 ± 0.5 µm vs. slc12a2bue58 13.4 ± 1.9 µm vs. slc12a2bue58+ TTX 6.1 ± 0.9 µm). Error bars represent mean ± SD. One-way ANOVA followed by Tukey’s multiple comparison test was used to assess statistical significance (ANOVA F(2,27) = 97, P < 0.0001). Each point represents an individual animal. ****, P < 0.0001. (D) Schematic overview of when, where, and for how long TTX was applied to either constitutive or glial-specific slc12a2b mutants. (E) Confocal images of 6 dpf slc12a2bue58 mutant larvae. Top and bottom panels show the same region of the pLLn before and 4–6 h after injection with either a control solution (left), or TTX (right). Scale bar, 20 µm. (F) Confocal images of 6 dpf Tg(mbp:EGFP-CAAX) larvae, in which slc12a2b has been targeted in myelinating glial cells. Top and bottom panels show the same region of the pLLn before and 4–6 h after injection with either a control solution (left) or TTX (right). Scale bar, 20 µm. (G) Quantitation of the change in mean myelinated nerve diameter following injection with either a control solution or TTX in slc12a2b mutants (G; sham injected −0.6 ± 1.1 µm vs. TTX −3.2 ± 1.6 µm, P < 0.0001) or animals in which slc12a2b has been disrupted specifically in myelinating glial cells (H; sham injected −0.4 ± 1 µm vs. TTX −2.5 ± 1.7 µm, P < 0.0001). Two-tailed Student’s t test was used to assess statistical significance. Each point represents an individual animal. ****, P < 0.0001. |