FIGURE SUMMARY
Title

Application of optogenetic Amyloid-β distinguishes between metabolic and physical damages in neurodegeneration

Authors
Lim, C.H., Kaur, P., Teo, E., Lam, V.Y.M., Zhu, F., Kibat, C., Gruber, J., Mathuru, A.S., Tolwinski, N.S.
Source
Full text @ Elife

ZFIN is incorporating published figure images and captions as part of an ongoing project. Figures from some publications have not yet been curated, or are not available for display because of copyright restrictions.

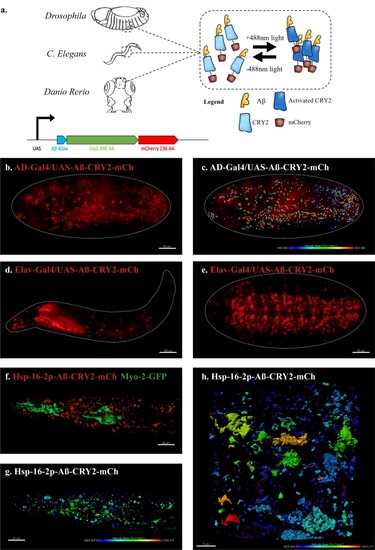
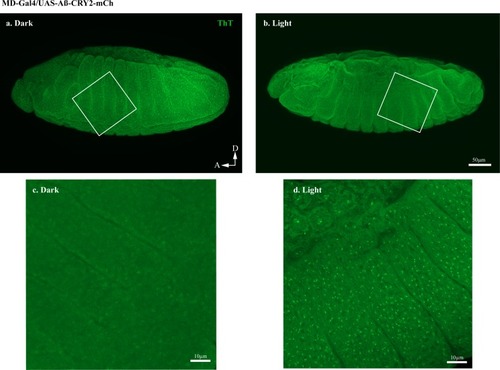
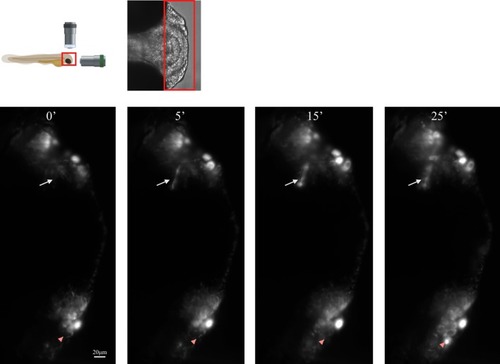
An in vivo, light-dependent, oligomerization switch for the formation or dissolution of Aβ aggregates in the fruit fly and nematode.

(a) A schematic of the strategy and a relative size comparison of the three components of UAS-Aβ-CRY2-mCh. (b) Expression of AD-Gal4/UAS-Aβ-CRY2-mCh in a Drosophila embryo. (c) Mean intensity of aggregates in the same AD-Gal4/UAS-Aβ-CRY2-mChDrosophilaembryo. (d and e) Expression of Elav-Gal4/UAS-Aβ-CRY2-mCh in a Drosophila larva and embryo. (f) Expression of hsp-16–2 p-Aβ-CRY2-mCh in heat-shocked C. elegans with myo-2-gfp marker, that marks its pharyngeal pump and serves as an indicator for positive microinjection. (g and h) Mean intensity of aggregates in the hsp-16–2 p-Aβ-CRY2-mCh in C.elegans under 20x and 63x magnification of the confocal microscope; 63x image was processed using the Zeiss Airyscan.


Transgenic <italic>Drosophila</italic> model expressing Aβ-CRY2-mCh.

(a–d) Still images from lightsheet timelapse microscopy of Elav-Gal4/UAS-Aβ-CRY2-mCh in neurons detected by mCh fluorescence (red) in transgenic Drosophila embryos at different developmental stages. (e) Aβ localization to neuronal cell body volume in a Drosophila embryo expressing the mentioned construct.

Exposure to light drives Aβ aggregation in <italic>C. elegans</italic> strains 24 hr post heat- shock.

(a) Confocal microscopy images of mutant C. elegans 24 hr post heat-shock at 20x magnification in Aβ -HS L (no heat shock, exposed to light), Aβ HS L (with heat shock, exposed to light) and Aβ HS D (with heat shock, kept in the dark) conditions. Aβ -HS L worms are used as a control for quantifying baseline Aβ expression. Distinct puncta (yellow) can be seen in animals in Aβ HS L condition. No red fluorescence was observed in control animals without the transgene (not shown). (b) Quantification of intensity of red fluorescence measured in the animals in Aβ HS L (n = 13), Aβ HS D (n = 9) and Aβ -HS L (n = 5) conditions 24 hr post heat-shock. Difference in expression between Aβ HS L conditions and Aβ -HS L is statistically significant (p=0.034). (C) Quantification of total area of bright puncta in the animals in Aβ HS L (n = 13), and Aβ HS D (n = 9) conditions 24 hr post heat-shock. Difference in area of fluorescence between Aβ HS L conditions and Aβ HS D is statistically significant (p=0.031).

Light-induced Aβ aggregation in <italic>Drosophila</italic> embryos resulted in distinct developmental defects.

(a) Still images from a 24 hr recording of Elav-Gal4/UAS-Aβ- CRY2-mCh aggregates in a Drosophila embryo without blue light illumination resulted in normal development. Time stages t = 1–6 showed embryonic development stages 12–13 (~440–620 min after fertilization), where germ band retraction starts and ends respectively. Germ band was 5.125 mm at t = 1, and retracted to 2.875 mm by t = 6. (b) Still images from a 24 hr recording of Elav-Gal4/UAS-Aβ-CRY2-mCh aggregates in a Drosophila embryo with blue light illumination every 2.5 min resulted in the arrest of embryogenesis during late germ band retraction stages. Time stages t = 1–6 showed embryonic development from late stage 10 to early stage 12 (~300–460 min after fertilization), where germ band retraction begins (stage 12). Germ band was 5.125 mm at t = 1, and retracted only to 4.25 mm by t = 6. (c) Still images from a 24 hr recording of uniform expression AD-Gal4/UAS-Aβ-CRY2-mCh aggregates in a Drosophila embryo without blue light illumination resulted in normal development. Time stages t = 1–6 showed embryonic development stages 14–16 (~620–900 min after fertilization), where dorsal closure of midgut and epidermis and shortening of ventral nerve cord occurs. In this case, the ventral nerve cord shortening was not clearly visible. (d) Still images from a 24 hr recording of AD-Gal4/UAS-Aβ-CRY2-mCh aggregates in a Drosophila embryo with blue light illumination at every 2.5 min resulted in the arrest of embryogenesis at dorsal closure stages. Time stages t = 1–6 corresponded to embryonic development stage 14 (approximately 620–680 min after fertilization), where dorsal closure begins.

Thioflavin T (ThT) staining showing the Aβ aggregation transgenic <italic>Drosophila</italic> embryos ubiquitously expressing Aβ-CRY2-mCh.

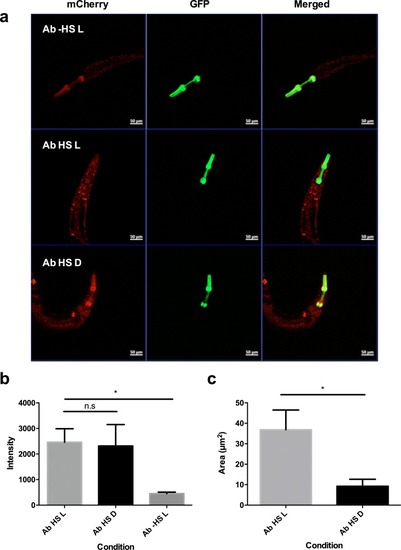
Embryos expressing Aβ-CRY2-mCh ubiquitously showed significantly lesser Aβ aggregates in the (a) dark as compared to (b) embryo exposed to light. (a, b) were imaged at 20x. (c, d) were magnified images of the box in (a, b) imaged at 63x.

Fluorescence recovery after photobleaching (FRAP) analysis of Aβ-CRY2-mCh expressing cells compared to Arm-CRY2-mCh expressing cells in<italic>Drosophila</italic>gut.

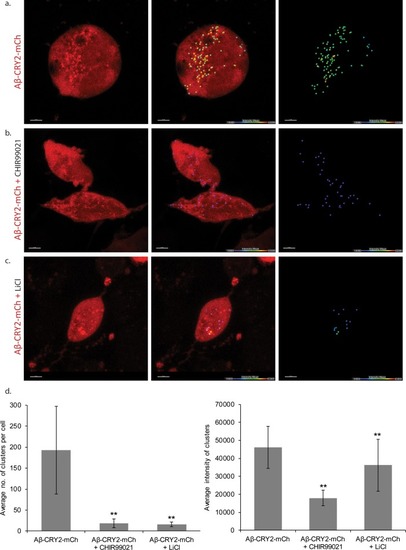
Images and percentage fluorescence recovery after bleaching of (a) Aβ-CRY2-mCh expressing intestinal stem cells from esg-Gal4, UAS-GFP; UAS--Cry2-mCh flies and (b) Arm-CRY2-mCh expressing stem cells from esg-Gal4, UAS-GFP; UAS-Arm-Cry2-mCh flies. Aβ-Cry2-mCh showed a much slower recovery of fluorescence post-bleaching as compared to an unrelated CRY2 construct (Arm-CRY2-mCh). Scale bar represents 5 µm.

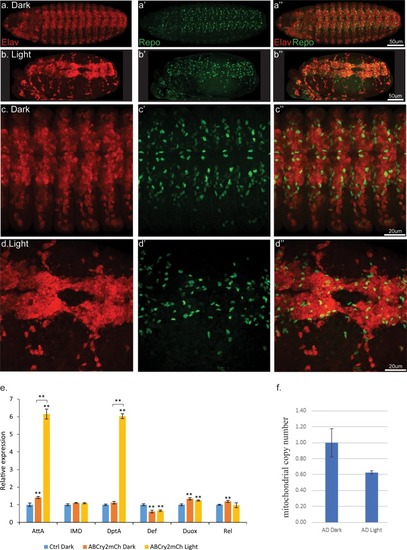
Light induced aggregation causes physical disruption of embryonic neural tissues.

(a–a’’) Elav-Gal4/UAS-Aβ-CRY2-mCh embryos kept in the dark and imaged for neurons (Elav) and glial cells (Repo). (b–b’’) Elav-Gal4/UAS-Aβ-CRY2-mCh embryos exposed to light and imaged for neurons (Elav) and glial cells (Repo). (c–d’’) Close ups. (E) Aggregation induced inflammatory response as measured by qPCR for inflammatory response genes. (f) The number of mitochondria in transgenic Aβ Drosophila embryo was reduced by 40% in light.


Light-induced Aβ aggregation leads to developmental deficits in transgenic <italic>Drosophila</italic> embryo.

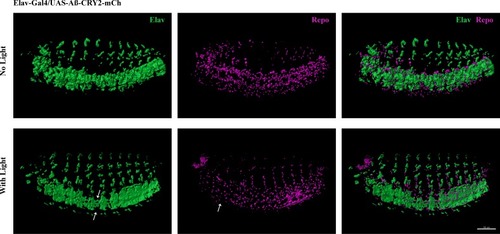
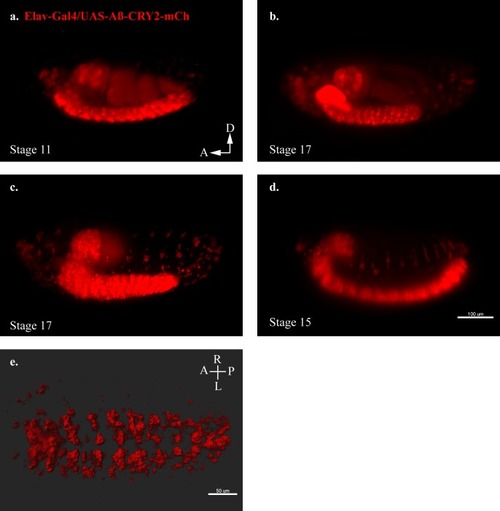
Reduction of neurons and glia cells (arrows) detected by immunostaining of Elav and Repo in transgenic Aβ Drosophila embryos imaged at 40x.

HEK cells expressing Aβ-CRY2-mCh in light condition.

(a) Untreated control HEK cells show light-induced clustering of Aβ-CRY2-mCh and increased number of vacuoles under blue light illumination. (b) HEK cells treated with GSK3 inhibitor CHIR99021 (positive control) show little clustering of the light-induced Aβ-CRY2-mCh. Fewer cellular vacuoles observed. (c) HEK cells treated with lithium chloride show homogenous expression of Aβ-CRY2-mCh, whereby blue light illumination did not result in significant clustering of Aβ-CRY2-mCh. (d) Quantification of cluster number per cell showed significantly reduced cluster formation in cells treated with CHIR99021 and lithium chloride as compared to control cells. (**p<0.01) (e) Quantification of the mean intensity of the clusters showed significantly reduced intensity of the clusters when the cells were treated with GSK3 inhibitor CHIR99021 and lithium chloride as compared to control cells.

Transgenic Aβ model in <italic>Danio Rerio embryo</italic> expressing Aβ-CRY2-mCh (red).

Schematic of lightsheet imaging/illumination lens orientation to D. rerio embryo, and stills from Video 4.

Acknowledgments
This image is the copyrighted work of the attributed author or publisher, and ZFIN has permission only to display this image to its users. Additional permissions should be obtained from the applicable author or publisher of the image. Full text @ Elife