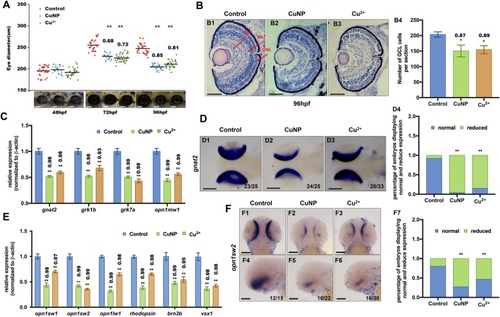
Retinal developmental defects in copper stressed embryos. A Measurement of eye diameter of the embryos from control, Cu2+- and CuNPs- stressed groups at 48 hpf, 72 hpf, and 96 hpf, respectively. B H&E staining analysis of retina of embryos from control (B1), Cu2+-stressed (B2) and CuNPs-stressed groups (B3) at 96 hpf. Control embryos at 96 hpf developed normal retina with a differentiated GCL (ganglion cell layer), an INL (inner nuclear layer), and an ONL (outer nuclear layer) (indicated by the red arrows). (B4) Average number of GCL cells per section/per embryo in each group (n > 3, 3–5 sections from each embryo were used for counting the GCL cells). C Expression of retinal marker genes gnat2, grk1b, grk7a, and opnlmw1 in embryos from control, Cu2+-stressed, and CuNPs-stressed groups. D WISH data of gnat2 in embryos from control, Cu2+-stressed, and CuNPs-stressed groups, respectively (D1-D3), and the percentage of embryos exhibiting reduced expression in different groups (D4). E Expression of retinal marker genes opn1sw1, opn1sw2, opn1lw1, rhodopsin, brn3b, and vsx1 in embryos from control, Cu2+ − stressed, and CuNPs-stressed groups. F WISH data of opn1sw2 in embryos from control, Cu2+-stressed, and CuNPs-stressed groups, respectively (F1-F6), and the percentage of embryos exhibiting reduced expression in different groups (F7). B1-B3, sagittal slides in eyes domain; D1-D3, dorsal view, anterior to the left; F1-F3, dorsal view, anterior to the up; F4-F6 lateral view, anterior to the left. Scale bar: A, B1-B3, and F1-F6, 100 μm; D1-D3, 200 μm **, P < 0.01; *, P < 0.05

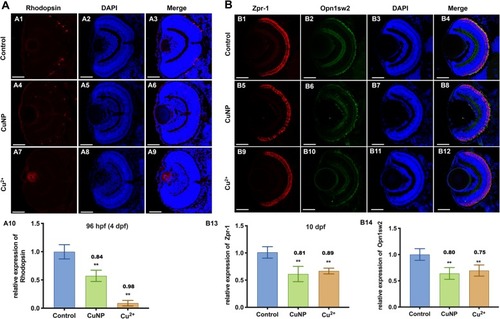
Protein levels of retinal photoreceptor in copper stressed embryos. A Immunostaining of Rodopsin (labeling retinal rod cells) (A1-A9). B Double immunostaining of ZPR-1 (labeling retinal cone cells) and Opn1sw2 (blue opsin, labeling retinal rod cells) in embryos at 10 dpf. A10, B13, B14, Quantification of protein level in each sample. Scale bars: A1-A9 and B1-B12, 50 μm; **, P < 0.01; *, P < 0.05

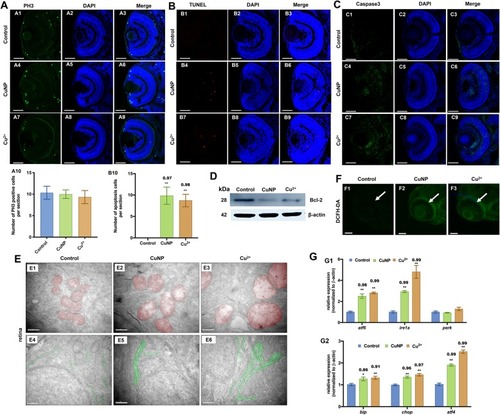
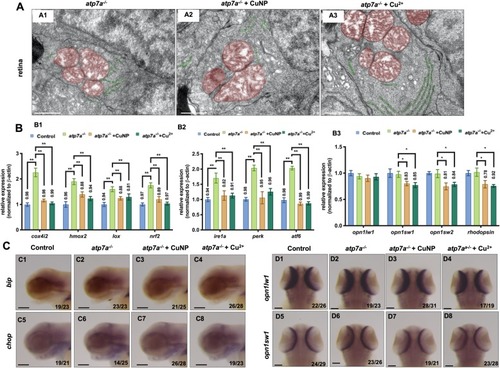
Cell proliferation, apoptosis, and oxidative & ER stresses in copper-stressed embryos. A Cell proliferation assay by PH3 staining (green dots). B Cell apoptosis assay by TUNEL (red dots) detection. (A, B) sections of embryonic eyes. A10, number of PH3 positive cells per section, B10, average number of apoptotic cells of retinal sections in each group (n > 3, 3–5 sections from each embryo were used for counting the red positive apoptotic cells). C Immunostaining of Caspase3 (green) in retina sections. D Western blot detection with antibody Bcl-2 in copper-stressed embryos. E TEM analysis of retinal cells in copper-stressed embryos at 96 hpf. E1-E6: sagittal slides of retina, red color indicating mitochondria and green color indicating ER. F DCHF-DA assay of embryonic retina. G qRT-PCR detection of ER-stressed genes in embryos at 96 hpf. Scale bars: A1-A9, B1-B9 and C1-C9, 50 μm; E1-E6, 0.5 μm; F1-F3, 100 μm; **, P < 0.01; *, P < 0.05

ER stresses in copper-stressed and BFA-treated embryos. A Phenotypes of representative copper-stressed embryos with or without BFA. BFA treatment destroys the COPII function and induces ER stresses, A7, measurement of eye diameters of the embryos. A1-A6, lateral view, anterior to the left. B Protein levels of P­eIF-2α in copper-stressed embryos with or without BFA (B1) and the quantification of protein levels of P­eIF-2α in each sample (B2). C Western blot detection of XBP1-s in copper-stressed embryos (C1) and the quantification of protein level in each sample (C2). D Immunostaining of PDI (ER marker) in copper-treated embryos. D1-D3, merged images of immunostaining of PDI (green) and DAPI staining (blue); D4, D5 and D6 were magnified domains of white boxes marked in D1, D2 and D3, respectively. D1- D6, sagittal slides in eyes domain. Scale bar: A1-A6, 0.2 mm; D1-D9, 50 μm; D10-D12, 10 μm. **, P < 0.01; *, P < 0.05

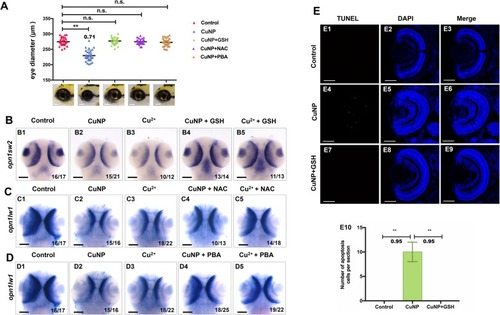
Rescue of retinal defects with the addition of ROS scavenger and ER stress scavenger. ROS scavengers GSH & NAC and ER scavenger PBA recovered the copper induced small eye defects (A) and the expression of retinal markers opn1sw2 (B1-B5) & opn1lw1 (C1-C5 and D1-D5) in copper-stressed embryos. E ROS scavengers GSH significantly neutralized copper induced cell apoptosis in embryos. Average number of apoptotic cells of retinal sections in each group (E10) (n > 3, 3–5 sections from each embryo were used for counting the red positive apoptotic cells). B1-B5, C1-C5, and D1-D5, dorsal view, anterior to the up; E1- E9, sagittal slides in eyes domain. Scale bar, A, B1-B5, C1-C5, and D1-D5, 100 μm; E1-E9, 50 μm. **, P < 0.01; *, P < 0.05

Retina development in cox17−/− mutant treated with copper. A TEM analysis of retinal cells in copper stressed cox17−/− mutant embryos at 96 hpf. A1-A3, sagittal slides of retina, red color indicating mitochondria and green color indicating ER. B Quantitative PCR of ROS related genes (B1; cox4i2, hmox2, lox, and nrf2), UPR related genes (B2; ire1a, perk, and atf6), and retinal genes (B3; opn1wl1, opn1sw1, opn1sw2 and rhodopsin) in cox17−/− mutants. C WISH assays of ER stress marker bip and chop in cox17−/− mutants. D WISH assays of retinal marker genes (opn1wl1 and opn1sw1) in cox17−/− mutants. C1-C8, lateral view, anterior to the left, D1-D8, dorsal view, anterior to the up, and Scale bar: A1-A3, 1 μm; C1-C8 and D1-D8, 100 μm. **, P < 0.01; *, P < 0.05

Retina development in atp7a−/− mutant treated with copper. A TEM analysis of retinal cells in copper-stressed atp7a−/− mutant embryos at 96 hpf. A1-A3, sagittal slides of retina, red color indicating mitochondria and green color indicating ER. B Quantitative PCR of ROS related genes (B1; cox4i2, hmox2, lox, and nrf2), UPR related genes (B2; ire1a, perk, and atf6), and retinal genes (B3; opn1wl1, opn1sw1, opn1sw2 and rhodopsin) in atp7a−/− mutants. C WISH assays of ER stress marker bip and chop in atp7a−/− mutants. D WISH assays of retinal marker (opn1wl1 and opn1sw1) in atp7a−/− mutants. C1-C8, lateral view, anterior to the left, D1-D8, dorsal view, anterior to the up. Scale bar: A1-A3, 1 μm; C1-C8 and D1-D4, 100 μm; **, P < 0.01; *, P < 0.05

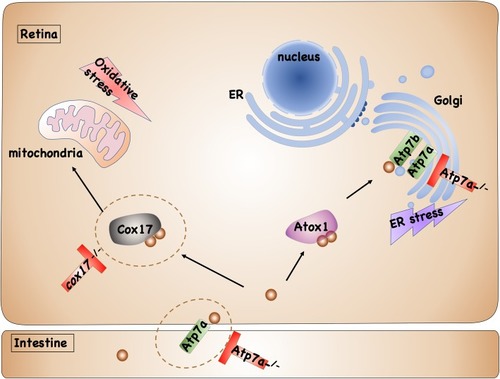
Model of copper induced retinal developmental defects in WT, cox17−/−, and atp7a−/− embryos

ZFIN is incorporating published figure images and captions as part of an ongoing project. Figures from some publications have not yet been curated, or are not available for display because of copyright restrictions.

ZFIN is incorporating published figure images and captions as part of an ongoing project. Figures from some publications have not yet been curated, or are not available for display because of copyright restrictions.

ZFIN is incorporating published figure images and captions as part of an ongoing project. Figures from some publications have not yet been curated, or are not available for display because of copyright restrictions.

ZFIN is incorporating published figure images and captions as part of an ongoing project. Figures from some publications have not yet been curated, or are not available for display because of copyright restrictions.

ZFIN is incorporating published figure images and captions as part of an ongoing project. Figures from some publications have not yet been curated, or are not available for display because of copyright restrictions.

EXPRESSION / LABELING:
Gene:
Fish:
Condition:
Anatomical Term:
Stage: Day 4
PHENOTYPE:
Fish:
Condition:
Observed In:
Stage: Day 4
Acknowledgments
This image is the copyrighted work of the attributed author or publisher, and ZFIN has permission only to display this image to its users. Additional permissions should be obtained from the applicable author or publisher of the image. Full text @ Cell Commun. Signal.