
- Title
-
Neurogenesis in the inner ear: the zebrafish statoacoustic ganglion provides new neurons from a Neurod/Nestin-positive progenitor pool well into adulthood
- Authors
- Schwarzer, S., Asokan, N., Bludau, O., Kuscha, V., Kaslin, J., Hans, S.
- Source
- Full text @ Development

Anatomy of the statoacoustic ganglion (SAG) in the adult zebrafish. (A-L) H&E staining (A-C,G-I) and immunohistochemistry (D-F,J-L) of cross-sections through the entire inner ear show the innervation of the pars superior, the dorsal part of the inner ear consisting of the anterior (A,D), the lateral (B,E) and the posterior cristae (H,K) and the utricular macula (B,C,E,F) as well as the pars inferior, the ventral part of the inner ear including the saccular macula (G,J) and the lagenar macula (I,L) by the SAG, the eighth cranial nerve. Neurons of the SAG express the neuronal markers HuC/D (labelling neuronal cell bodies) and Calretinin [labelling neuronal cell bodies as well as the axons (purple arrowheads)]. Hair cells in the sensory patches are labelled using pou4f3:GFP (green arrowheads). The former position of the three otoliths lapillus (utricular macula), sagitta (saccular macula) and asteriscus (lagenar macula) are visible as light purple residual structures left after decalcification of the otoliths, close to the sensory hair cells in the H&E staining (A-C,G-I; marked with yellow asterisks). (M) Close-up of the medial part of the SAG at the level of the utricular macula; comparison of HuC/D with Calretinin reveals that the latter only labels a subpopulation of neurons in the dorso-lateral part of the SAG (green and white arrowheads point to HuC/D-positive but Calretinin-negative neurons). Bottom panels in M show magnification of boxed area in top panel. Scale bars: 200 µm for A-L; 50 µm for M. Cross-sections show dorsal to the top and lateral to the right. Distance from first section through semicircular canals to the section of interest: anterior cristae (A) 0.5 mm; lateral cristae (B) 1.39 mm; utricular macula (C) 1.66 mm; posterior cristae (G) 2.53 mm; saccular macula (H) 3.15 mm; lagenar macula (I) 3.44 mm. |

Number and density of HuC/D-positive neurons decreases during growth of the SAG. (A) Antibody staining against neuronal marker HuC/D in the SAG of 2- and 8-month-old fish. The entire anterior part of the SAG was analyzed, starting with the first section with HuC/D-positive neurons and ending with the last section of the anterior part of the SAG. Shown are the second, middle and second-last section as well as the section with the highest density of HuC/D-positive cells. Note that in 2-month-old fish, the section with the highest density of HuC/D-positive cells is found in the first half of the anterior SAG, whereas at 8 months it is usually found in the last quarter of the anterior SAG. (B-E) Quantification of HuC/D-positive neurons in the entire anterior part of the SAG, showing that the overall number of HuC/D-positive cells (B), the average number of HuC/D-positive cells per section (C) and highest number of HuC/D-positive cells on one section (D) decreases, whereas the overall thickness of the anterior SAG along the anteroposterior axis (E) increases during growth. Scale bars: 50 µm. Cross-sections show dorsal to the top and lateral to the right. For all quantifications: n=4 fish with mean values calculated of all sections of both anterior SAGs; data are presented as mean±s.e.m. Unpaired two-tailed Student's t-test. **P≤0.01; ***P≤0.001. |

Proliferation and neurogenesis rapidly decrease at juvenile stages and is severely reduced in the adult zebrafish SAG. (A,B) Antibody staining showing proliferation (PCNA), neurod:GFP-positive cells and mature neurons (HuC/D) in the SAG of juvenile (2 and 3 months) and adult (8 and 20 months) neurod:GFP zebrafish. (A) At juvenile stages, neurod:GFP-positive cells proliferate (neurod:GFP/PCNA-positive cells, solid arrowheads) and give rise to new neurons (neurod:GFP/HuC/D-positive cells, arrows). In contrast, neurod:GFP-positive cells (open arrowheads) are not proliferating in adult fish and neurod:GFP/HuC/D-positive cells are rarely found. (B) Proliferating PCNA-positive but neurod:GFP-negative cells (arrowheads) can be found in the vicinity of the neurod:GFP-positive population at all stages. Panels on right show magnification of boxed areas in left panels. (C-G) Quantification of antibody staining. The overall number of PCNA-positive cells (C), the overall number of neurod:GFP-positive cells (D) and neurod:GFP/PCNA-positive cells (E) significantly decrease from 2 to 3 months, leaving only few PCNA-positive cells but no neurod:GFP/PCNA-positive cells at 8 months. (F) The number of newborn neurons marked by neurod:GFP and HuC/D decreases significantly from 2 to 3 and further from 3 to 8 months. (G) The number of cells in the neurod:GFP-positive pool that are neither proliferating nor positive for HuC/D stays constant over time. Scale bars: 50 µm. Cross-sections show dorsal to the top and lateral to the right. For quantifications: 2 months, n=3; 3 months, n=3; adult, n=4 (n=fish; 1 SAG/fish; 12 sections/SAG); data are presented as mean±s.e.m. Ordinary one-way ANOVA with Tukey's multiple comparison test. *P≤0.05; **P≤0.01; ***P≤0.001. |
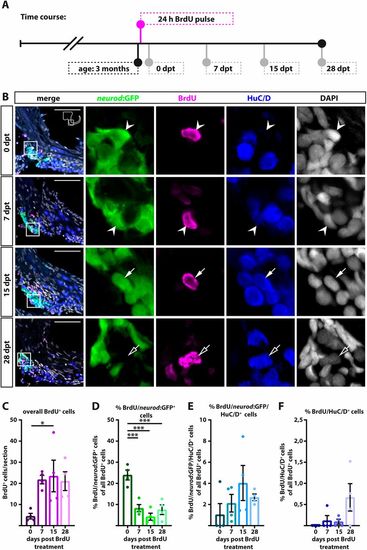
neurod:GFP-positive cells are proliferating and give rise to new neurons at juvenile stages. (A) Time course of the BrdU pulse chase experiment: 3-month-old Tg(neurod:GFP) zebrafish were sacrificed at 0, 7, 15 and 28 dpt. (B) Antibody staining shows BrdU/neurod:GFP-positive cells (0 and 7 dpt, arrowheads) which differentiate into BrdU/neurod:GFP/HuC/D-positive (15 dpt, solid arrows) and BrdU/HuC/D-positive neurons (28 dpt, open arrows). Panels on right show magnification of boxed areas in left panels. (C-F) Quantification of antibody staining. (C) The overall number of BrdU-positive cells increases from 0 dpt to later time points, indicating continued proliferation of precursor cells. (D) Percentage of BrdU/neurod:GFP-positive cells of all BrdU-positive cells decreases significantly from 0 dpt to later time points. (E) At 7 dpt, some BrdU/neurod:GFP-positive cells have already differentiated into immature BrdU/neurod:GFP/HuC/D-positive cells. (F) First newborn BrdU/HuC/D-positive neurons appear as early as 7 dpt and the percentage of BrdU/HuC/D positive neurons increases over time. Scale bars: 50 µm. Cross-sections show dorsal to the top and lateral to the right. For all quantifications n=4 (n=fish; 1 SAG/fish; 12 sections/SAG); data are presented as mean±s.e.m. Ordinary one-way ANOVA with Tukey's multiple comparison test. *P≤0.05; ***P≤0.001. |

A proliferating but marker-negative cell population replenishes the neurod:GFP-positive cell pool at adult stages. (A) Time course for BrdU pulse chase experiment: 8-month-old Tg(neurod:GFP) zebrafish were sacrificed at 0, 7, 14 and 29 dpt. (B) Antibody staining reveals that BrdU-positive cells never co-localize with neurod:GFP at 0 dpt (open arrowheads). However, BrdU/neurod:GFP-positive cells are present at 7 dpt (solid arrowheads). Newly generated neurod:GFP-positive cells can either differentiate into new neurons [BrdU/neurod:GFP/HuC/D-positive cells (solid arrows) and BrdU/HuC/D-positive cells (open arrows)], as can be seen as early as 14 dpt, or remain in the pool of neurod:GFP-positive cells (solid arrowheads) as can be seen at 29 dpt. Panels on right show magnification of boxed areas in left panels. (C-F) Quantification of overall BrdU-positive cells (C) as well as percentage of BrdU-positive-only cells (D), BrdU/neurod:GFP-positive cells (E) and BrdU/HuC/D-positive cells as a fraction of all BrdU-positive cells (F). Scale bars: 50 µm. Cross-sections show dorsal to the top and lateral to the right. For quantifications: 0, 7, 14 days, n=5; 29 days, n=4 (n=fish; 1 SAG/fish; 12 sections/SAG); data are presented as mean±s.e.m. Ordinary one-way ANOVA with Tukey's multiple comparison test. |

Nestin expression labels embryonic neuronal progenitors and overlaps with neurod:GFP expression at juvenile and adult stages. (A) Antibody staining showing nestin:GFP expression in the region of the neurod:GFP-positive cells. nestin:GFP-positive cells are proliferating (nestin:GFP/PCNA-positive cells, solid arrowheads) and differentiate into neurons (nestin:GFP/HuC/D-positive cells, arrows) in 2-month-old zebrafish. (B) nestin:mCherry-T2A-CreERT2 is expressed in the neurod:GFP-positive progenitor pool (open arrowheads) in 2- and 6-month-old zebrafish; expression of nestin:mCherry-T2A-CreERT2 persists longer in newly differentiated neurons than neurod:GFP expression (arrows). (C) Time course of nestin:mCherry-T2A-CreERT2 long-term lineage tracing experiment. Recombination in Tg(nestin:mCherry-T2A-CreERT2), Tg(hsp70l:loxP-DsRed2-loxP-nlsEGFP) double-transgenic embryos was induced from 5-30 hpf. At 7 months, zebrafish were heat shocked four times within 24 h to activate the reporter and afterwards analyzed for nestin:CreERT2-derived cells. (D) Co-staining of GFP-positive nestin:CreERT2-derived cells with HuC/D shows the presence of nestin:CreERT2-derived/HuC/D-positive cells (arrows). (E,F) Quantification of GFP-positive (recombined) and GFP-negative (non-recombined) HuC/D-positive cells (E) and percentage of recombined HuC/D-positive cells (F). Panels on right show magnification of boxed areas in left panels. Scale bars: 50 µm. Cross-sections show dorsal to the top and lateral to the right. Quantification: n=3 (n=fish; 1 SAG/fish; 12 sections/SAG); data are presented as mean±s.e.m. |

Expression of glia markers and differences in myelination patterns mark the PCTZ in the SAG. (A) Antibody staining against Claudin K showing the PCTZ (dashed line) as a sharp boundary, visible as a change in the myelination pattern in the SAG in 2-month-old fish. (B) Antibody staining against the glia marker her4.3:GFP and HuC/D in 3-month-old zebrafish reveals expression of her4.3:GFP in the medial part of the SAG, similar to the myelination expression pattern (dashed line); HuC/D-positive neurons reside lateral from the PCTZ. (C) Co-staining of the glia marker GFAP and the myelination marker Mbp shows a similar expression pattern as reported in A and B, with the PCTZ marked by a change in the myelination pattern and medial expression of the glia marker. Panels on right show magnification of boxed areas in left panels. Scale bars: 200 µm. Cross-sections show dorsal to the top and lateral to the right. |

Sox2-positive cells reside along the PCTZ outside the NeuroD/Nestin-positive progenitor pool in the SAG. (A) Antibody staining against Sox2 reveals that Sox2-positive cells (arrowheads) are present along a line in the medial portion of the adult SAG. (B) Co-staining for GFAP and sox2:GFP in the sox2:GFP reporter shows presence of sox2:GFP-positive cells (arrowheads) only a few microns lateral of the GFAP staining. (C) Co-staining for GFAP and neurod:GFP reveals presence of neurod:GFP-positive cells ∼50 µm away from the GFAP-positive zone (arrowheads). Panels on right show magnification of boxed areas in left panels. Scale bars: 200 µm. Cross-sections show dorsal to the top and lateral to the right. |