
- Title
-
Cell fusion is differentially regulated in zebrafish post-embryonic slow and fast muscle
- Authors
- Hromowyk, K.J., Talbot, J.C., Martin, B.L., Janssen, P.M.L., Amacher, S.L.
- Source
- Full text @ Dev. Biol.

Live imaging of slow muscle cell migration concurrent with fast muscle fusion events. (A–F) Frames from a time-lapse movie (Supplemental Movie 1) of a 19 hpf six1b:lyn-GFP (green); smyhc1:lyn-tdTomato (magenta) double transgenic embryo. (A′-F′) Pseudo-colored images show the slow muscle channel (white) from frames (A–F) overlaid with the shape of two fast muscle precursors (green) as they interact with slow muscle cells and extend anteriorly. Dotted outlines in A′ show somite boundaries (yellow). (G–N) Frames from a time-lapse movie of a 20 hpf six1b:lyn-GFP (green); smyhc1:lyn-tdTomato (blue) double transgenic embryo injected with mRNA encoding H2B-CFP (fuchsia). The movie (Supplemental Movie 2), which spans 92.5 min, was taken when fusion is actively occurring. (G′-N′) Illustrations depict a pair of fusing cells from Supplemental Movie 2 (G-N; white arrowhead). The time stamp of each frame is indicated. Scale bars in F’ (for A-F′) and N (for G-N) are 20 μm. |

Embryonic skeletal muscle fusion requires mymk. (A) The mymk CRISPR target site is within exon 3. (B) DNA lesions for mymkoz17 and mymkoz25 induced at the CRISPR target sequence (bold text), with the corresponding wild-type (WT) sequences (red text is deleted in mutant). (C) The resulting frame-shifting mutations are predicted to introduce 4 and 30 aberrant amino acids respectively (grey text), followed by a premature stop codon (∗) that would truncate the protein in transmembrane (TM) domain 5 and eliminate C-terminal fusogenic elements (Millay et al., 2016). (D) Forward (fwd) and reverse (rev) primers (orange arrowheads) for RT-PCR amplify exons 1 through 6 of the cDNA including the mymkoz17 lesion site in exon 3 (green arrowhead). (E) RT-PCR of mymk and jam2a transcripts in wild-type (WT) and mymkoz17 mutant individuals at 48 hpf. (F-G′) Wild-type embryos (F, F′) contain multinucleated fast fibers at 48 hpf, while fast fibers in mymkoz17 mutant embryos (G, G′) are mononucleate, with the single nucleus in each fiber located about midway between fiber tips. myog:H2B-mRFP (white) marks myonuclei, mylfpa:lyn-cyan (green) labels fast muscle cells, and smyhc1:EGFP (aqua) labels slow muscle cells. (H) The total number of myonuclei per somite is reduced in mymk mutants compared to WT siblings beginning at 48 hpf. Myonuclei in somites 12 and 15 of each embryo were counted and averaged to get the number per somite (n = 6 for 24 hpf, n = 8 for 48 hpf and 72 hpf). (Student’s t-test, p∗∗∗ < 0.001). Scale bar in G’ (for F-G′) is 100 μm. |
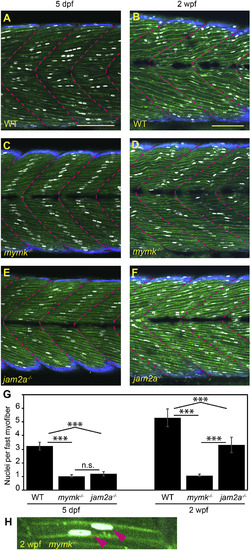
jam2a is no longer required for multinucleation by 2 weeks post fertilization. (A–F) Sagittal confocal sections of 3MuscleGlow transgenic fish at 5 dpf (A, C, E) and 2 wpf (B, D, F). myog:H2B-mRFP (white) labels myonuclei, mylfpa:lyn-cyan (green) marks fast muscle cell membranes, and smyhc1:EGFP (aqua) marks slow muscle cells; myotomal boundaries are indicated by dotted lines (magenta). (G) Quantitative analysis reveals that mymk mutant myofibers are typically mononucleate at both stages. jam2a mutant myofibers, which are typically mononucleate at 5 dpf, are consistently multinucleate at 2 wpf. (H) An example of a rare mymk mutant fast myofiber with two nuclei (red arrows). Scale bars in A (for A, C, E) and B (for B, D, F) are 100 μm. Significance determined by ANOVA with Tukey-Kramer post-hoc analysis (p∗∗∗ < 0.001 compared to WT; n.s. indicates not significant). PHENOTYPE:
|
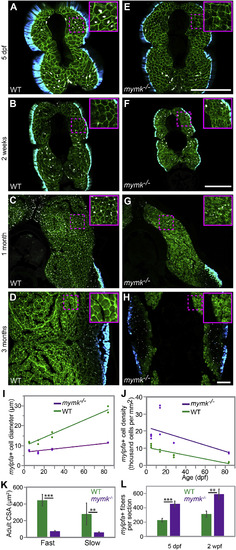
mymk is required for normal myofiber growth. Transverse sections through the mid-trunk region of wild-type (WT) (A–D) and mymkoz17 (E–H) 3MuscleGlow transgenic fish at 5 days, 2 weeks, 1 month, and 3 months post-fertilization. myog:H2B-mRFP (white) labels myonuclei, mylfpa:lyn-cyan (green) marks fast muscle cell membranes, and smyhc1:EGFP (aqua) marks slow muscle cells. Insets show magnified images of regions indicated by the dotted box. (I) Diameter of mylpfa-expressing fast muscle cells in WT and mymkoz17 individuals at the same stages, with trends over time determined by linear regression (model R2 is 0.97). (J) Fast muscle cell density is shown for the same WT (green) and mymkoz17 (purple) individuals as in (I) and regression lines show trends through time (model R2 is 0.63). Linear regression was performed in JMP using standard least squares modeling. (K) Adult myofiber cross-sectional area is higher in WT than mymkoz17 in both slow and fast myofiber types. (L) Total myofiber counts per section are lower in WT than in mymkoz17 at 5 dpf and 2 wpf. Scale bars in E (for A, E), in F (for B, F, C, G), and in H (for D, H) are 100 μm. Student’s t-test, p∗∗<0.01, p∗∗∗< 0.001. |
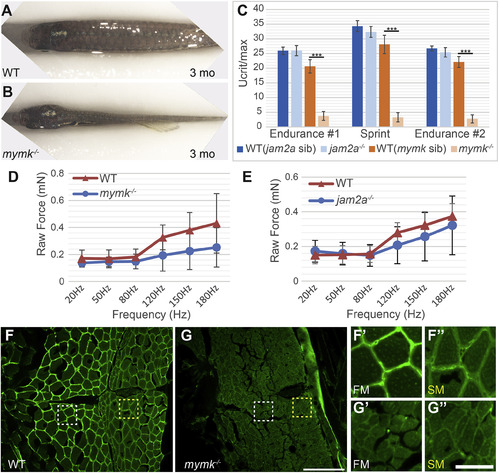
Muscle performance is severely compromised in adult mymk mutants. (A, B) Dorsal view of wild-type (WT) (A) and mymk mutant (B) adult fish showing the difference in muscle size. jam2a individuals are indistinguishable from wild-type (Shi et al., 2018; Zhang and Roy, 2017; and data not shown). (C) Swim tunnel performance of adult fish (3–6 months) reveals a dramatic difference in endurance and sprint capacity of mymk mutant and wild-type siblings (n = 5 each) but no difference between jam2a mutant and wild-type siblings (n = 6 each). (D, E) Assays of raw contractile force in stimulated 3 dpf mymk mutant and sibling control larvae (D) (n = 3–10 tested per frequency) and jam2a mutant and sibling control larvae (E) (n = 4 WT and n = 6 jam2a mutant embryos tested per frequency) indicate no significant force difference among comparable genotypes. At higher frequencies, muscle-specific force trends lower in both mutants but the difference is not statistically significant. (F-G″) Transverse sections of adult WT (F-F″) and mymk mutants (G-G″), near the horizontal myoseptum, immunolabeled to detect Laminin (green). Magnified views of boxed regions in F and G show fast muscle (FM; white box) (F′ and G′) and slow muscle (SM; yellow box) (F″ and G″) regions of WT and mymk mutant individuals respectively. Scale bar in G (for F and G) is 100 μm and scale bar in G’’ (for F′-G″) is 25 μm. Student’s t-test, p∗∗∗ <0.001. PHENOTYPE:
|

Cell proliferation and Pax7-positive satellite-like cell number are dramatically increased in adult mymk mutants. (A, B) Transverse sections near the horizontal myoseptum (HM) of wild-type (WT) (A) and mymk mutant (B) adult skeletal muscle showing Pcna expression (grey) which marks proliferating nuclei. (A′ and B′) Magnified images of boxed regions in A and B. (C) Graph showing the average number of Pcna-positive cells per mm2 near the HM in WT and mymk mutant adults. (D, E) Transverse sections of pax7a:GFP (green); myog:H2B-mRFP (magenta) transgenic WT (D) and mymk mutant (E) adult skeletal muscle co-labeled for Pax7 (red), Rbfox1l (blue), and pax7a:GFP (green). pax7a:GFP marks satellite-like cells (SLCs) as well as cells that have begun to differentiate; SLCs can be unambiguously identified by their intensely Pax7-positive nuclei. myog:H2B-mRFP (magenta) marks myonuclei; expression of myog:H2B-mRFP and pax7a:GFP transgenes rarely overlap in adult WT muscle (Berberoglu et al., 2017). (F) The average number of Pax7-positive cells per mm2 near the HM and in dorsal fast muscle of WT and mymk mutant adults. (G-K′) Magnified views of boxed regions in D and E show the merged (G, G′) and individual confocal channels for Pax7 (H, H′), pax7a:GFP (I, I′), myog:H2B-mRFP (J, J′) and Rbfox1l (K, K′) in adult WT (G–K) and mymk mutant (G′-K′) muscle. Arrowheads indicate SLCs (yellow), myoblasts (teal), and myofibers (magenta). (L) Summary of cell types based on expression overlap. (M) Number of SLCs (strongly Pax7-positive and GFP-positive), myoblasts (GFP- and Rbfox1l-positive), and myofibers (Rbfox1l- and RFP-positive) in WT and mymk mutant adult slow and fast muscle domains. Student’s t-test (p∗∗∗ < 0.001, p∗∗ < 0.01). Scale bar in B (for A and B) and E (for D, E) is 100 μm, in B’ (for A′ and B′) is 15 μm, and in K’ (for G-K′) is 20 μm. PHENOTYPE:
|

Fast and slow myofiber size is tightly correlated to myonuclei number in both wild-type and fusion-impaired mutant fish. (A–F) Individual myofibers were isolated from wild-type (WT) (A, D), jam2ahu3319 mutant (B, E) and mymkoz17 mutant (C, F) adults. Myonuclei are marked by expression of the myog:H2B-mRFP transgene (white), fast myofibers by the mylfpa:lyn-cyan transgene (A-C, green), and slow myofibers by the smyhc1:EGFP transgene (D-F, blue). Yellow arrowheads indicate two of the nuclei in a mymkoz17 mutant slow fiber (F). (G) Graph showing the average nuclei per fast (green) and slow (blue) myofiber isolated from WT, jam2a mutant, and mymk mutant adults. (H) Myofiber volume was calculated for the same isolated myofibers by measuring length, area, and then applying the formula for volume of a cylinder. (I) The average myofiber volume per nucleus, an approximation of myonuclear domain size, is similar for all fast myofibers and for all slow myofibers, regardless of genotype. (J) At earlier times, we also found no difference in fast muscle myonuclear domain size among WT (black), jam2a hu3319 mutant (brown), and mymkoz17 mutant (purple) larvae (myofiber volume per nucleus was calculated using 5 dpf and 2 wpf datasets from Fig. 3). (K-L′) Individual fast (K) and slow (L) myofibers were isolated from 3 wpf WT fish, and shown as merged images, color-coded as above (K, L), and as myog:H2B-mRFP single channel images (K′, L′). Scale bars in A (for A-F) and K (for K-L′) are 100 μm. Significance determined by ANOVA and Tukey-Kramer post-hoc analysis (p∗∗∗ < 0.001 compared to WT; n.s. indicates not significantly different from WT at P of 0.05). |

As slow muscle fusion ensues, mymk is expressed in cells near myofibers, but not in myofibers themselves. (A–B) Transverse sections of wild-type larvae at 2 weeks post fertilization (wpf) (A) and 4 wpf (B), processed by fluorescent in situ hybridization (FISH) to detect smyhc1 (magenta) and mymk (green) transcripts; arrowheads (yellow) indicate a subset of the mymk-positive cells. Magnified images (A′ and B′) of boxed regions in A and B show that smyhc1 (A″ and B″) and mymk (A‴ and B‴) are expressed in distinct cell types at both time points. Scale bar in B (for A, B) is 100 μm and in B‴ (for A′-B‴) is 25 μm. EXPRESSION / LABELING:
|

ZFIN is incorporating published figure images and captions as part of an ongoing project. Figures from some publications have not yet been curated, or are not available for display because of copyright restrictions. EXPRESSION / LABELING:
|
Reprinted from Developmental Biology, 462(1), Hromowyk, K.J., Talbot, J.C., Martin, B.L., Janssen, P.M.L., Amacher, S.L., Cell fusion is differentially regulated in zebrafish post-embryonic slow and fast muscle, 85-100, Copyright (2020) with permission from Elsevier. Full text @ Dev. Biol.