FIGURE SUMMARY
Title

Molecular and cellular determinants of motor asymmetry in zebrafish

Authors
Horstick, E.J., Bayleyen, Y., Burgess, H.A.
Source
Full text @ Nat. Commun.

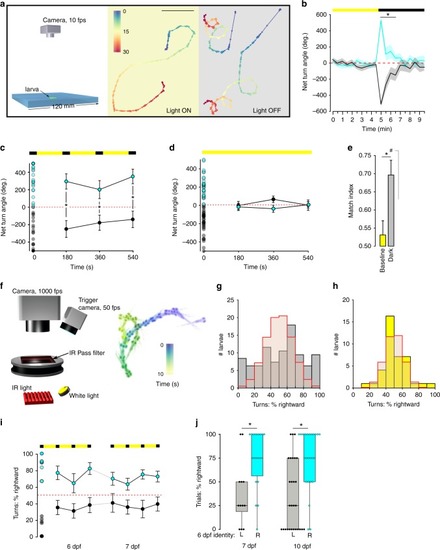
Individual larvae show persistent motor asymmetry during dark-induced circling.

a Swim trajectories during baseline illumination and after loss of light. Color scale: time (seconds). Arrowheads, orientation. Scale bar 20 mm. b NTA over 30-s intervals for larvae before/after loss of illumination. Individuals were classified as right- (cyan, N = 25) or left-biased (gray, N = 34) based on the first 30-s interval. Asterisk p < 0.05, d = 3.1, 0.71, 0.66, and 0.61 (first four time points in the dark), t test between groups. c NTA for 30-s light-off trials (black bars). Open circles at time 0 show individual larvae, and were used to classify as right- (cyan, N = 34) or left-biased (black, N = 34). Subsequent points show mean and standard deviation for left/right groups. Asterisk p < 0.05, t test between groups. d As for (c) during constant illumination (right, N = 29; left, N = 35). e Match Index during baseline illumination (yellow, N = 64) and after loss of illumination (gray, N = 68). Asterisk p < 0.05, r = 0.29, Mann–Whitney U test, and #p < 0.05, r = 0.76, one-sample permutation test against 0.5. f Visually isolated chamber. Right: time-lapse montage over 10 s following loss of illumination. Color: time (seconds). g, h Percentage of turns executed rightward (mean of four 10-s trials) after loss of illumination (g, gray, N = 89) or during constant illumination (h, yellow, N = 39). Red line: expected distribution, Monte Carlo simulation of unbiased larvae. i Rightward-turn preference over 24 h. Larvae with <33% of rightward turns at 6 dpf were classified as left-biased (black, N = 12), and those >66% as right-biased (cyan, N = 14). At 7 dpf, % rightward-turn use in L/R-classified groups. Repeated measures ANOVA for 7-dpf trials, the effect of 6-dpf first-trial direction F1,24 = 15.4, p < 0.001, η2p = 0.39. Asterisk p < 0.05 between groups. j Percentage trials with net rightward bias for larvae tested at 7 or 10 dpf (N = 30, 52), after left/right classification at 6 dpf. Asterisk p < 0.05, r = 0.61 and 0.60 (7 and 10 dpf), Mann–Whitney U test. Error bars: standard error of the mean. Box plots show median and quartiles with whiskers indicating 10–90%. Source data are provided as a Source Data file.

Motor asymmetry is correlated across multiple behavioral tasks.

a Experimental paradigm: larvae were classified as left-/right-biased at 6 dpf based on circling response after loss of illumination (over 4 trials). At 7 dpf, the same larvae were tested in either a two-target phototaxis assay or acoustic startle assay. b Representative path trajectories for right- (cyan) and left- (gray) classified larvae (arrowhead) presented with two symmetric light spots following loss of illumination. c Percent of trials on which larvae turned toward the right spot, for larvae classified at 6 dpf as left-biased (gray, N = 12) and right-biased (cyan bar, N = 13). Each larva performed four trials, with trials excluded if the larva was adjacent to the arena edge when light spots were presented. Asterisk p < 0.05, r = 0.51, Mann–Whitney U test. d Percentage of startle responses made in a rightward direction for larvae preclassified as left- (gray) or right- (cyan) biased. Larvae were tested either in the dark (gray background) or light (yellow background) conditions. As acoustic stimuli elicit either short- or long-latency C starts (SLC, LLC) that are mediated by different circuits, response types were analyzed separately. Red diamond indicates mean. Dark LLC responses: left N = 19, right N = 20. Dark SLC responses: left N = 12, right N = 14; light LLC responses: left N = 27, right N = 23; light SLC responses: left N = 18, right N = 28. Asterisk p < 0.05, r = 0.71, 0.51, and 0.35, respectively, Mann–Whitney U test. e Match index for atoh7 mutants and siblings during baseline illumination (sib, N = 45; mutant, N = 57; yellow bars) and dark conditions (sib, N = 51; mutant, N = 58; gray bars). Asterisk p < 0.05, r = 0.74, 0.20, and 0.41, respectively, one-sample permutation test to 0.5. f NTA for each of four trials after unilateral enucleation of the left (gray, N = 4) or right (cyan, N = 6) eye. Dotted red line: random output. Repeated measures ANOVA, the effect of side-lesioned, F1,7 = 115.8, p < 0.001, η2p = 0.94. Asterisk p < 0.05 between groups. Error bars represent standard error of the mean. Box plots show median and quartiles with whiskers indicating 10–90%. Source data are provided as a Source Data file.

Neurons in the posterior tuberculum maintain left/right identity.

a Chemogenetic ablation screen: transgenic lines with restricted Gal4 patterns were crossed to a UAS:epNTR-RFP reporter. Both epNTR-RFP+ and non-fluorescent siblings (as controls) were treated with metronidazole before testing for motor asymmetry under light and dark conditions. b Match index for drug-treated controls (y279N = 53; y375N = 43; otpbAN = 35) and following genetic ablation (y279N = 57; y375N = 37; otpbAN = 46) during paired baseline (yellow) and dark (gray) responses. Asterisk p < 0.05, r = 0.31, 0.49, 0.3, and 0.34, respectively (left to right); #p < 0.05, r = 0.25, Mann–Whitney U test. c, d Whole-brain dorsal Zebrafish Brain Browser (ZBB) projections for y279 (c) and y375 (d). Color is depth scale. e Computed intersect y279 and y375 expression patterns. Arrowhead indicates a cluster in the rostral PT. f Dorsal confocal projection through the rostral PT in (top) y279-Gal4, UAS:Kaede (green) crossed to vglut2a:dsRed (red) or (bottom) y279-Gal4, UAS:Kaede (green) crossed to gad1b:dsRed (red). Scale bar 20 µm. g Match index in unablated controls (N = 45) and after bilateral laser ablation of the PT (N = 17) and Hc (N = 19) during baseline (yellow) and on dark trials (gray). Asterisk p < 0.05, r = 0.44 and 0.59, respectively, Mann–Whitney U test. h Net turn angle (mean on trials 1–4) for the left PT hemisphere (gray, N = 27) and the right PT hemisphere (cyan, N = 23) ablations. Hc unilateral ablations (right bars) (left hemisphere gray, N = 24; right hemisphere cyan, N = 22). Asterisk p < 0.001, d = 1.3, t test. i Percentage of dark evoked long-latency startle responses initiated in the rightward direction for intact controls (N = 23), left (N = 15) or right (N = 14) hemisphere PT ablation. Asterisk p < 0.001, d = 1.4, t test. Error bars represent standard error of the mean. Box plots show median and quartiles with whiskers indicating 10–90%. Source data are provided as a Source Data file.

Neurons in the posterior tuberculum respond to changes in illumination.

a Raster plot of mean calcium responses (mean of three trials) from GCaMP6s expressing PT neurons. Color scale denotes standardized change in fluorescence intensity (ΔF/F). Illumination conditions as indicated on the X axis (light ON, orange; dark, gray). Only a subset of no-response neurons are included. b Location of light OFF-responsive neurons in the rostral PT. Scale bar indicates fluorescence (ΔF/F) change over baseline. c Mean and standard error for response of light OFF- (green, N = 46) and light ON- (purple, N = 14) responsive neurons. d Mean and standard error for response of light OFF- (green, N = 8) responsive neurons during the 3-min dark period. e Peak change in fluorescence for neurons that respond to light OFF in the left (PTL) and right (PTR) PT for larvae classified as left (red) and right (blue) motor-biased. f Location of light OFF-responsive neurons within the PT for larvae behaviorally identified as left- (red) or right- (blue) biased. Error bars represent standard error of the mean. Box plots show median and quartiles with whiskers indicating 10–90%. Source data are provided as a Source Data file.

A projection from posterior tuberculum to habenula drives motor asymmetry.

a, b 3D rendering of y279-Gal4, UAS:Kaede expression in the habenula at 7 dpf in intact larvae (a) and after bilateral ablation of y279-expressing PT neurons (b). Arrow indicates habenular commissure present in intact larvae that is lost after bilateral PT ablation. Scale bar 20 µm. c, d Confocal projections of y279-Gal4;UAS:Kaede-expressing larvae following unilateral focal photoconversion of Kaede in the left (c) or right (d) rostral PT. Photoconverted Kaede in the red channel is saturated to facilitate visualization of PT projections. Scale bar 20 µm. e Net turn angle (mean of trials 2–4) for intact control larvae (N = 47) and after bilateral ablation of y279-expressing habenula neurons (N = 22). Larvae were classified as left-biased (gray) or right-biased (cyan) based on trial 1 (T1). Asterisk p < 0.001, d = 1.4, t test. f Total amount of turning for larvae in (e) during locomotion under baseline illumination (yellow) or dark-induced circling behavior (gray). g Net turn angle (mean of trials 1–4) in non-ablated controls (white, N = 47), and following unilateral ablation of the left (gray, N = 33) and right (cyan, N = 28) habenula nuclei, or following laser section of the habenular commissure (c) (N = 24). Asterisk p < 0.001, d = 0.90, t test. #p < 0.05, d = 0.73, one-sample t test to 0. h Representative confocal scan showing y279-labeled habenular commissure (arrow) in a control larva (top). Following ablation commissure is absent (bottom). Scale bar 20 µm. Error bars represent standard error of the mean. Box plots show median and quartiles with whiskers indicating 10–90%. Source data are provided as a Source Data file.

Left/right identity is disrupted by mutations in genes that regulate Notch signaling.

a, b Curly-up morphology in 2-dpf y606 mutant (a) and sibling larvae (b). c Net turn angle for moey606 wild-type (left, +/+) and heterozygous (right, +/−) sibling larvae over four 30-s light-off trials. Open circles in the first trial (time 0) represent individual NTA for all larvae tested, and were used to classify larvae as right- (cyan, Het N = 20; WT N = 20) or left-biased (black, Het N = 27; WT N = 20). Subsequent points represent mean for left/right groups on trials 2–4. Repeated measures ANOVA effect of genotype F1,81 = 3.8, p = 0.05, η2p = 0.05. d Same analysis as in (c) for moeb476 allele showing right- (cyan, Het N = 11; WT N = 15) or left-biased (black, Het N = 25; WT N = 9) larvae. Repeated measures ANOVA interaction of genotype/motor-bias F1,56 = 5.3, p<0.05, η2p = 0.09. Asterisk p < 0.05 between groups in (c, d). e Absolute net turn angle for moey606 heterozygous (N = 47) and wild-type sibling (N = 40) larvae averaged over four trials for baseline illumination (yellow bar) and light-off (gray bar) trials. f Habenula and heart placement in wild-type siblings and moey606 heterozygous larvae. Left: percentage of larvae with a larger habenula hemisphere on each side (N = 32 and 25 for wild type, hets). Right: percentage of embryos with the heart positioned on the left, right, or midline (N = 25 and 31 for wild type, hets). g, h Match index (g) and total turning (h) for wild-type siblings and mibta52b heterozygous larvae (N = 31 and 27, respectively), during baseline (yellow) and dark (gray) responses. Asterisk p < 0.05, r = 0.42, Mann–Whitney U test. Error bars represent standard error of the mean. Source data are provided as a Source Data file.

Motor asymmetry in zebrafish.

a For a right-biased larva, the dominant right PT-habenula pathway imposes right motor bias by modulating symmetric visual drive and suppressing the left PT-habenula pathway. b Competition between PT-habenula units is eliminated after unilateral ablations, strengthening motor bias. c Asymmetric visual input after unilateral enucleation overrides PT-habenula modulation of motor output. d Symmetric visual stimuli, after bilateral ablation of PT-habenula units, eliminate motor bias leading to randomized turn direction.

Acknowledgments
This image is the copyrighted work of the attributed author or publisher, and ZFIN has permission only to display this image to its users. Additional permissions should be obtained from the applicable author or publisher of the image. Full text @ Nat. Commun.