FIGURE SUMMARY
Title

Conserved Genoarchitecture of the Basal Hypothalamus in Zebrafish Embryos

Authors
Schredelseker, T., Driever, W.
Source
Full text @ Front. Neuroanat.

Gene expression domains demarcate alar and basal territories within the secondary prosencephalon as well as tuberal and mamillary subregions within the basal hypothalamus. (A–F″) Sagittal optical sections of zebrafish embryos 48 hpf at medial, ventricular or more lateral, mantle positions as indicated, stained by double-fluorescent whole-mount in situ hybridization using probes as indicated. (G) Integration of several prevalent anatomical models of the zebrafish embryonic forebrain referencing orientation colinear to the body axis (Wullimann et al., 1996; Manoli and Driever, 2014; Biran et al., 2015; Mueller and Wullimann, 2016; Muthu et al., 2016). (H) Proposed model of hypothalamus subdivision into mamillary and tuberal areas at ventricular (H′) or mantle zones (H″) with anatomic directions colinear to the neuraxis. Dashed box in (A″) indicates area which is shown in higher magnification in Supplementary Figure S2A. Arrowhead in (A″) indicates the rostral border of the floor plate. The alar-basal boundary is shown in cyan. Maximum intensity projections of 10 (A–A″), 15 (C–C″), 25 (B–B″,D–D″,F–F″), or 35 (E–E″) 1 μm confocal planes. Abbreviations see list. Scale bar 50 μm.

bsx expression in relation to other patterning factors within the basal hypothalamus. (A–F″) Sagittal optical sections of zebrafish embryos 48 hpf, stained by double-fluorescent whole-mount in situ hybridization using probes as indicated. Schematics show expression patterns of pax6a, pax7a(G), bsx(H), otpa and isl1(I) in and close to the basal hypothalamus. Asterisk in (A″) indicates arxa expression in the floor plate. Arrowheads indicate the domain we operationally define as “PTv.” The alar-basal boundary is shown in cyan. Maximum intensity projections of 20 (A–B″,D–E″), 25 (F–F″), or 30 (C–C″) 1 μm confocal planes. Abbreviations see list. Scale bar 50 μm.

Longitudinal and transverse subdivisions of the mamillary regions based on conserved gene expression domains. (A–D″) Sagittal optical sections of ventricular hypothalamic regions in zebrafish embryos 48 hpf, stained by double-fluorescent whole-mount in situ hybridization using probes as indicated. (E) Schematic showing subdomains of the mamillary region and the genes expressed therein. The alar-basal boundary is shown in cyan. Maximum intensity projections of 10 (C–D″), 15 (A–A″), or 30 (B–B″) 1 μm confocal planes. Abbreviations see list. Scale bar 50 μm.

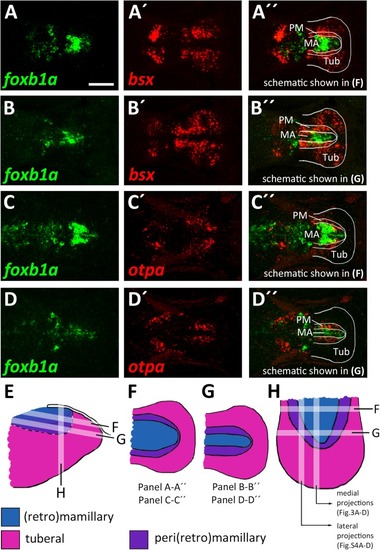
Radial organization of the basal hypothalamus. (A–D″) Horizontal optical sections of ventricular hypothalamic regions in zebrafish embryos 48 hpf, stained by double-fluorescent whole-mount in situ hybridization using probes as indicated. (E) Schematics showing lateral view on basal hypothalamus with tuberal and mamillary regions color coded as indicated. Section planes of schematics representing horizontal (F,G) and sagittal (H) projections are shown. Maximum intensity projections of 10 (A–B″,D–D″) or 15 (C–C″) 1 μm confocal planes. Abbreviations see list. Scale bar 50 μm.

Longitudinal and transverse subdivisions of the tuberal hypothalamus based on conserved gene expression domains. (A–G″) Sagittal optical sections of ventricular hypothalamic regions in zebrafish embryos 48 hpf, stained by double-fluorescent whole-mount in situ hybridization using probes as indicated. The alar-basal boundary is shown in cyan. Maximum intensity projections of 20 (E–E″), 30 (A–A″,C–C″,G–G″), 40 (D–D″,F–F″), or 50 (B–B″) 1 μm confocal planes. Abbreviations see list. Scale bar 50 μm.

agrp and penka expression in tuberal subregions. Sagittal optical sections of hypothalamic regions in zebrafish embryos 48 hpf (A), 96 hpf (B), or 72 hpf, stained by double-fluorescent whole-mount in situ hybridization using probes as indicated. White arrowheads in (A,B) indicate agrp+ cells in the putative arcuate nucleus region; white arrows indicate agrp+ neurons in retrotuberal territories. White arrowhead in (C) indicates penka+ cells in the putative ventromedial hypothalamus region. The alar-basal boundary is shown in cyan. Maximum intensity projections of 20 (A), 30 (B), or 50 (C) 1 μm confocal planes. Abbreviations see list. Scale bar 50 μm.

Schematic representations of gene expression patterns in subdomains of the basal hypothalamus. (A) Schematic of a representative intermediate sagittal optical section highlighting all subdomains of the basal hypothalamus identified in this study. The alar-basal boundary is shown as thin cyan line with black border. White hatched lines indicate transverse boundaries between the peduncular and terminal hypothalamus as well as between the terminal (solid colors) and acroterminal (shown with black dotted overlay pattern) domains. The green/pink hatched gradient fill area indicates the mixed TuV- and TuI-like characteristics of the PRR (see main text for details). (B,C) Expression patterns of (B)bsx in purple and (C) other genes in red and green as indicated within the subdomains of the basal hypothalamus as depicted in (A), yellow indicates overlapping expression. The red-green hatched area in (C) indicates expression at different sagittal levels, thus no colocalization. Abbreviations see list.

Acknowledgments
This image is the copyrighted work of the attributed author or publisher, and ZFIN has permission only to display this image to its users. Additional permissions should be obtained from the applicable author or publisher of the image. Full text @ Front. Neuroanat.