
- Title
-
YAP Regulates Hematopoietic Stem Cell Formation in Response to the Biomechanical Forces of Blood Flow
- Authors
- Lundin, V., Sugden, W.W., Theodore, L.N., Sousa, P.M., Han, A., Chou, S., Wrighton, P.J., Cox, A.G., Ingber, D.E., Goessling, W., Daley, G.Q., North, T.E.
- Source
- Full text @ Dev. Cell

Yap Signaling Impacts HSPC Production in the Zebrafish Embryo (A) Whole-mount in situ hybridization (WISH) for runx1/cmyb in control and yap1mw48 mutants at 36 hpf. Scale bar, 100 μm. (B) Qualitative phenotypic distribution plot of embryos in (A) scored with low, medium, or high runx1/cmyb expression in the VDA at 36 hpf (n = 32 control, 33 yap1mw48; chi-squared test, ∗∗∗p < 0.001). (C) Whole-embryo qPCR on control and yap1mw48 mutants at 36 hpf (unpaired Student’s t test, ∗p < 0.05, ∗∗∗p < 0.001. Error bars indicate SEM). (D) WISH for runx1/cmyb at 36 hpf following heat-shock-mediated overexpression of constitutively active Yap (YapS87A, hs:Yap) at 12 hpf. Scale bar, 100 μm. (E) Distribution plot of embryos in 2D (n = 53 control, 48 hs:Yap; chi-squared test, ∗∗∗p < 0.001). (F) qPCR in 36 hpf embryos following Yap-OE at 12 hpf (unpaired Student’s t test, ∗p < 0.05, ∗∗∗p < 0.001. Error bars indicate SEM). (G) In vivo imaging of CD41:GFP in the CHT at 72 hpf after YAP-OE. Scale bar, 200 μm. (H) Quantification of fluorescent images in (G) (n = 9 control, 7 hs:Yap; unpaired Student’s t test, ∗p < 0.05. Error bars indicate SD). (I) rag1 expression in the thymus at 120 hpf with Yap-OE (n = 21). Scale bar, 100 μm. (J) Quantification of thymic area in (I) (n = 8; unpaired Student’s t test, ∗p < 0.05. Error bars indicate SD). (K) WISH for runx1/cmyb at 36 hpf following Yap-OE and sih morpholino (MO). The black bracket denotes VDA and arrowhead indicates uncleared primitive erythrocytes in the vein due to lack of blood flow. Scale bar, 100 μm. (L) Distribution plot of embryos in (K) (n ≥ 30 per condition; chi-squared test, ∗∗∗p < 0.001). (M) Quantification of runx1/cmyb staining intensity in (K) (n ≥ 30 per condition; two-way ANOVA and Tukey’s multiple comparison test, ∗p < 0.05, ∗∗∗p < 0.001. Error bars indicate SD). |
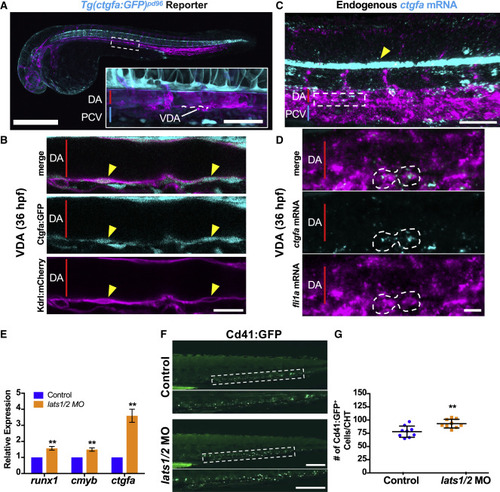
Endogenous Yap Signaling Is Sufficient to Induce HSPC Production (A) Maximum intensity projection (max proj.) of confocal z stack of double transgenic embryo at 36 hpf. Kdrl+ endothelium in magenta and Ctgfa+ cells in cyan. The dashed box denotes VDA and dotted line highlights region magnified in (B) (scale bars: 500 μm in overview and 50 μm in inset). DA, dorsal aorta; PCV, posterior cardinal vein. (B) Merge and single-color slices from (B) showing the Kdrl+ membrane surrounding Ctgfa+ cells (yellow arrowheads) in the VDA. Scale bar, 20 μm. (C) Max proj. of confocal z stack of 36 hpf WT embryo. Double fluorescent in situ hybridization of endogenous mRNA expression for fli1a (magenta) and ctgfa (cyan). Bright stripe of ctgfa in notochord (yellow arrowhead) mirrors GFP expression in the reporter line. The dashed box denotes the VDA region shown in Figure 3D. Scale bar, 50 μm. (D) Merge and single-color slices from confocal z stack showing a pair of neighboring fli1a+ ctgfa+ cells in the VDA. Scale bar, 10 μm. (E) qPCR in lats1/2 morphants at 36 hpf (∗∗p < 0.01. Error bars indicate SEM). (F) In vivo imaging for CD41:GFP in the CHT at 72 hpf in control and lats1/2 morphants. Scale bar, 200 μm. (G) Quantification of fluorescent images in (F) (n = 9; unpaired Student’s t test, ∗∗p < 0.01. Error bars indicate SD). |

YAP Activity Is Required for Maintenance, but Not Acquisition, of Hematopoietic Commitment in HE (A) WISH for runx1, cmyb, and gata2b at 24 hpf in WT and yap1mw48 mutants. Black arrowheads indicate putative HE cells expressing cmyb in VDA versus primitive erythrocytes in the vein not yet mobilized by circulation. Scale bar, 100 μm. (B) Distribution plots of embryos in (A) (n ≥ 30 per condition). (C) WISH for runx1, cmyb, and gata2b at 30 hpf in WT and yap1mw48 mutants. (D) Distribution plots of embryos in (C) (n ≥ 30 per condition; chi-squared test, ∗∗∗p < 0.001). (E) WISH for runx1/cmyb at 36 hpf upon Yap-OE at 12 hpf and treatment with DMSO or DAPT from 12–36 hpf. Scale bar, 100 μm. (F) Distribution plot of embryos in (E) (n ≥ 30 per condition; chi-squared test, ∗∗∗p < 0.001). (G) Quantification of runx1/cmyb staining intensity in (F) (n ≥ 30 per condition; two-way ANOVA and Tukey’s multiple comparison test, ∗∗p < 0.01, ∗∗∗p < 0.001. Error bars indicate SD). (H) Max proj. of confocal z stack of Flk1:GFP embryos (cyan) at 36 hpf following Yap-OE. EDU+ nuclei shown in magenta. Green arrowheads denote dorsal EDU+ endothelial nuclei in the aorta. Yellow arrowheads indicate Flk1+ EDU+ cells in the VDA and perivascular space between the DA and PCV. Scale bar, 50 μm. (I) Quantification of Flk1+ EDU+ cells in (H) (n = 20; unpaired Student’s t test, ∗∗∗p < 0.001. Error bars indicate SD). |

Rho-GTPases Drive Yap Mechanotransduction and HSPC Production In Vivo (A) WISH for runx1/cmyb at 36 hpf in WT embryos after treatment (12–36 hpf) with Rho-GTPase activators CN02, CN03, and CN04. Scale bar, 100 μm. (B) Distribution plot of embryos in (A) (n ≥ 50 per condition; chi-squared test, ∗p < 0.05, ∗∗∗p < 0.001). (C) qPCR after treatment with CN02 or CN04 (unpaired Student’s t test versus control, ∗p < 0.05, ∗∗p < 0.01, ∗∗∗p < 0.001. Error bars indicate SEM). (D) Quantification of CD41:GFP+ cells in images of the CHT at 72 hpf (n = 30 control, 23 CN02, and 22 CN04; unpaired Student’s t test; ∗∗∗p < 0.001. Error bars indicate SD). (E) WISH for runx1/cmyb at 36 hpf in sih morphants after CN02 treatment (12–36 hpf). Scale bar, 100 μm. (F) Distribution plot of embryos in (F) (n ≥ 50 per condition; chi-squared test, ∗∗∗p < 0.001). (G) qPCR in WT embryos and sih morphants at 36 hpf after CN02 treatment (unpaired Student’s t test, ∗∗p < 0.01, ∗∗∗p < 0.001. Error bars indicate SEM). |
Reprinted from Developmental Cell, 52(4), Lundin, V., Sugden, W.W., Theodore, L.N., Sousa, P.M., Han, A., Chou, S., Wrighton, P.J., Cox, A.G., Ingber, D.E., Goessling, W., Daley, G.Q., North, T.E., YAP Regulates Hematopoietic Stem Cell Formation in Response to the Biomechanical Forces of Blood Flow, 446-460.e5, Copyright (2020) with permission from Elsevier. Full text @ Dev. Cell