
- Title
-
Dstyk mutation leads to congenital scoliosis-like vertebral malformations in zebrafish via dysregulated mTORC1/TFEB pathway
- Authors
- Sun, X., Zhou, Y., Zhang, R., Wang, Z., Xu, M., Zhang, D., Huang, J., Luo, F., Li, F., Ni, Z., Zhou, S., Chen, H., Chen, S., Chen, L., Du, X., Chen, B., Huang, H., Liu, P., Yin, L., Qiu, J., Chen, D., Deng, C., Xie, Y., Luo, L., Chen, L.
- Source
- Full text @ Nat. Commun.
|

|

|
|

|
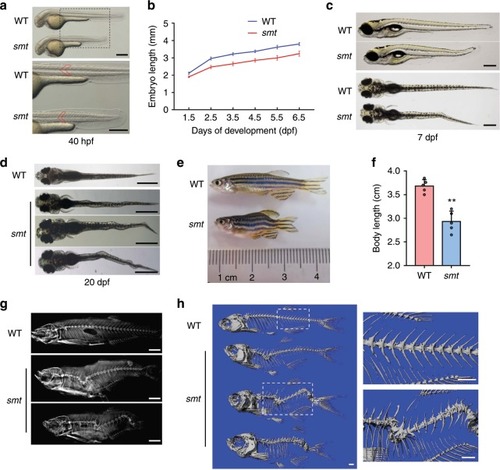
PHENOTYPE:
|

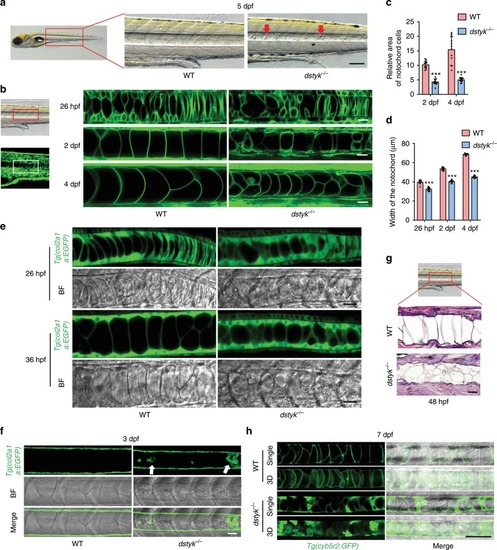
EXPRESSION / LABELING:
PHENOTYPE:
|

EXPRESSION / LABELING:
|
PHENOTYPE:
|

|

ZFIN is incorporating published figure images and captions as part of an ongoing project. Figures from some publications have not yet been curated, or are not available for display because of copyright restrictions. PHENOTYPE:
|
|
ZFIN is incorporating published figure images and captions as part of an ongoing project. Figures from some publications have not yet been curated, or are not available for display because of copyright restrictions. PHENOTYPE:
|
|
ZFIN is incorporating published figure images and captions as part of an ongoing project. Figures from some publications have not yet been curated, or are not available for display because of copyright restrictions. |
|
ZFIN is incorporating published figure images and captions as part of an ongoing project. Figures from some publications have not yet been curated, or are not available for display because of copyright restrictions. |
|
ZFIN is incorporating published figure images and captions as part of an ongoing project. Figures from some publications have not yet been curated, or are not available for display because of copyright restrictions. |