FIGURE SUMMARY
Title

Accelerated brain aging towards transcriptional inversion in a zebrafish model of the K115fs mutation of human PSEN2

Authors
Hin, N., Newman, M., Kaslin, J., Douek, A.M., Lumsden, A., Nik, S.H.M., Dong, Y., Zhou, X.F., Mañucat-Tan, N.B., Ludington, A., Adelson, D.L., Pederson, S., Lardelli, M.
Source
Full text @ PLoS One

Quantification of heterozygous mutant and wild type allele relative transcript expression.

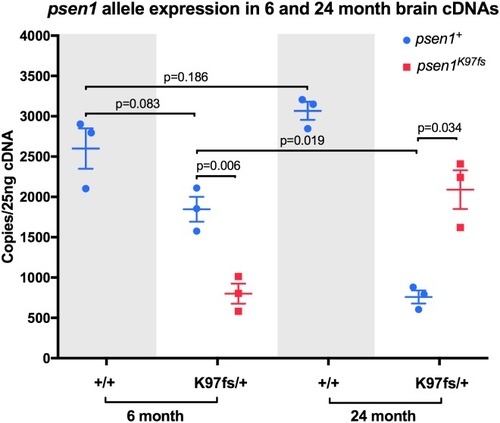
Digital quantitative PCRs specifically detecting transcripts from the heterozygous mutant (K97fs) or wild type (+) alleles of psen1 were performed using cDNA synthesised from total brain mRNA from fish at 6 and 24 months of age. Means and standard error of the means are indicated, and p-values are from two-sample t-tests assuming unequal variances.

EXPRESSION / LABELING:
Gene:
Fish:
Anatomical Term:
Stage: Adult

Summary of experimental groups, differentially expressed (DE) genes and differentially abundant (DA) proteins.

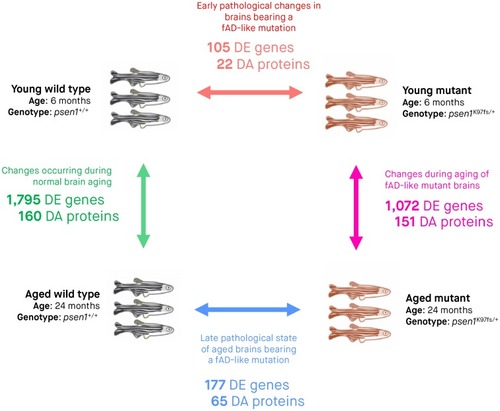
Three biological replicates (entire zebrafish brains) were subjected to RNA-seq and LC-MS/MS for each of the four experimental conditions. Arrows indicate pairwise comparisons (to identify DE genes and DA proteins) between experimental conditions. The numbers of DE genes and DA proteins determined from RNA-seq and LC-MS/MS analyses are indicated underneath the arrow for each comparison. We considered genes to be DE and proteins to be DA if the False Discovery Rate [FDR]-adjusted p-value of their moderated t-test (limma) was below 0.05. All zebrafish of the same age are siblings raised in the same tank.

Differential gene expression between heterozygous mutant (<italic>psen1</italic><sup><italic>K97fs/+</italic></sup>) and wild type (<italic>psen1</italic><sup>+/+</sup>) zebrafish brains at 6 months (young) and 24 months (aged).

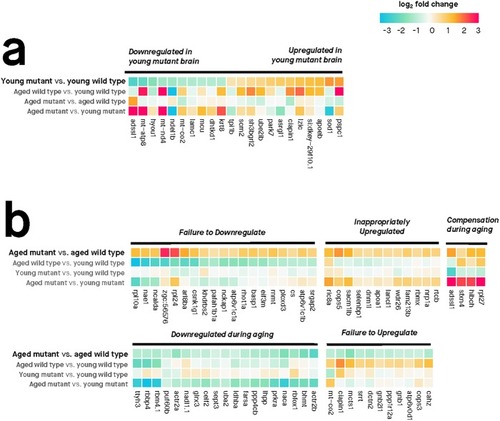
Only genes with absolute log2 fold change > 0.5 are shown. Genes were considered differentially expressed if their moderated t-test FDR-adjusted p-value was below 0.05. (A) Differentially expressed genes at 6 months. (B) Differentially expressed genes at 24 months. The differentially expressed genes are grouped into clusters based on gene expression changes across the four comparisons. Overall, note the similar expression changes in ‘young heterozygous mutant vs. young wild type’ and ‘aged wild-type vs. young wild-type’ and the contrast of these to comparisons involving aged heterozygous mutants. This illustrates the accelerated brain aging in young heterozygous mutant brains and the "inverted" gene expression pattern of aged heterozygous mutant brains.

Differential gene set expression in heterozygous mutant (<italic>psen1</italic><sup>K97fs/+</sup>) zebrafish brains compared to wild type siblings.

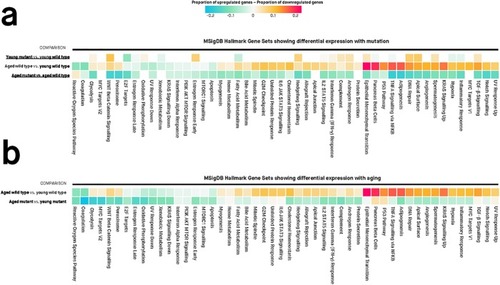
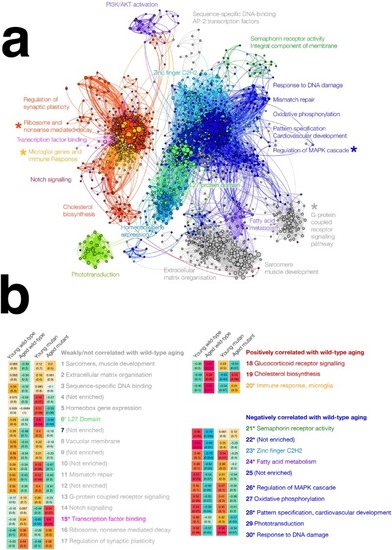
Values in each cell are the estimated proportions of up- and down-regulated genes for each gene set, for any particular pairwise comparison shown to the left of the cells. A missing cell indicates that the particular gene set is not differentially expressed for that particular pairwise comparison. Colours of cells are proportional to the difference between the proportion of up- and down-regulated genes in a gene set. Differentially expressed gene sets have Mixed FDR below 0.05, indicating genes within the gene set show statistically significantly altered (up and/or down) expression for a particular comparison. The genes in each gene set are defined using the “Hallmark” gene set collection at the Molecular Signatures Database (MSigDB). (A) Gene sets showing differential expression between heterozygous mutant (psen1K97fs/+) and wild type (psen1+/+) zebrafish brains at 6 months (young) and 24 months (aged). The comparison representing normal aging (aged wild type vs. young wild type) is also shown to highlight the ‘accelerated aging’ phenomenon in the young heterozygous mutants. (B) Gene sets showing differential expression during normal aging. The aged K97fs/+ vs. young K97fs/+) comparison is also shown to highlight the phenomenon of aberrant aging in the heterozygous mutants.

Protein abundance changes in the brains of heterozygous mutant (<italic>psen1</italic><sup><italic>K97fs/+</italic></sup>) zebrafish compared to wild type (<italic>psen1</italic><sup>+/+</sup>) siblings at 6 months (young) and 24 months (aged).

Protein abundance was quantified at the peptide-level with LC-MS/MS (liquid chromatography tandem mass spectrometry) and differential abundance was assessed using moderated t-tests (limma). Differentially abundant proteins are defined as those with FDR-adjusted p-value < 0.05. Protein names were used to retrieve equivalent gene symbols for display purposes on these heatmaps. (A) Differentially abundant proteins between young heterozygous mutant and wild type zebrafish brains. (B) Differentially abundant proteins between aged heterozygous mutant and wild type zebrafish brains. The proteins have been clustered according to their abundance changes across the four comparisons.

Zebrafish brain gene co-expression network.

(A) Gene co-expression network visualisation. Each node represents one gene, with node size proportional to the number of connected nodes (co-expressed genes). Edges represent co-expression between two genes, with edge weight proportional to the strength of co-expression. The co-expression network is a signed adjacency matrix constructed from RNA-seq data from wild type and heterozygous mutant zebrafish brains at 6 and 24 months of age. Only nodes with at least four connections are shown. Gene "modules" are groups of genes with similar expression patterns across heterozygous mutant and wild type zebrafish brains. In this network, 30 gene modules were identified using a hierarchical clustering and branch cutting method. Modules showing no significant changes in expression are coloured grey, modules showing significantly increased expression during wild-type brain aging are coloured red, while modules showing significantly decreased expression during wild-type brain aging are coloured blue. Modules with other colours also show signficantly altered expression during heterozygous mutant brain aging. See B for details. Asterisks indicate zebrafish brain gene modules which are significantly preserved in a co-expression network constructed from an independent human brain dataset. (B) Gene expression patterns of modules in the gene co-expression network across heterozygous mutant and wild type zebrafish brains at 6 months and 24 months of age. Values shown in cells are hybrid Pearson-robust correlations between the overall gene expression in a module (summarised using the first principal component) and experimental condition encoded as a binary variable (6-month-old heterozygous mutant, 24-month-old heterozygous mutant, 6-month-old wild type, 24-month-old wild type). Values in parentheses are unadjusted Student correlation p-values. Modules showing potentially altered expression patterns during heterozygous mutant aging compared to wild-type aging are labelled with coloured text, with colours corresponding to module colours in (A). Asterisks indicate zebrafish brain gene modules which are significantly preserved in a co-expression network constructed from an independent human brain dataset.

Module overlap between co-expression networks constructed using zebrafish and human brain gene expression data.

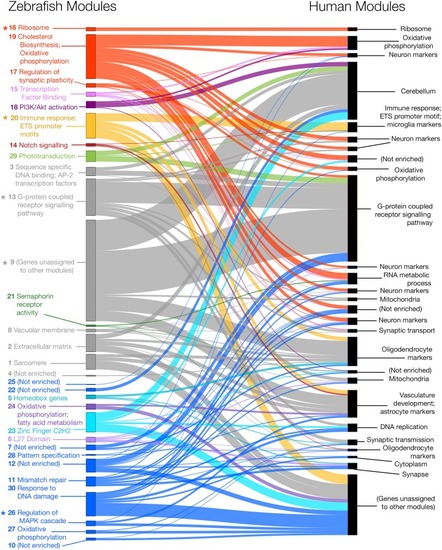
Zebrafish and human co-expression networks were constructed using 7,118 genes that were orthologs in zebrafish and humans and expressed in brain gene expression data. Modules of co-expressed genes were separately identified for both the zebrafish and human co-expression networks, resulting in 30 modules in the zebrafish network (left) and 27 modules in the human network (right). Several zebrafish modules (indicated with asterisks) were found to have Z-summary preservation score > 2, indicating statistically significant weak-to-moderate preservation of these modules (i.e. genes in these modules still tend to be co-expressed) in the human brain co-expression network. Four out of five of these modules also showed statistically significant functional enrichment. See Table 1 for more details on the Z-summary preservation scores and functional enrichment for each module in the zebrafish co-expression network.

Cells expressing L-plastin are more abundant across the heterozygous mutant (<italic>psen1</italic><sup><italic>K97fs/+</italic></sup>) zebrafish brain than in wild type siblings at 24 months.

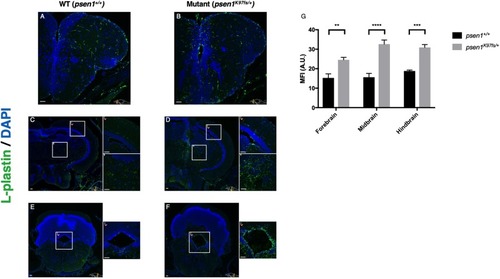
Immunostaining for the pan-leukocyte marker L-plastin supports increased numbers of microglia in the forebrain (A-B), midbrain (C-D) and hindbrain (E-F). Increased microglial abundance is evident in psen1K97fs/+ heterozygotes in both ventricular (D.i, F.i) and parenchymal (D.ii) regions compared to wild types (C, E). (G) Significant differences in MFI were observed between the forebrain, midbrain and hindbrain of psen1K97fs/+ and psen1+/+ fish; **p = 0.0048, ***p = 0.0005, ****p < 0.0001; two-way ANOVA with Sidak’s multiple comparisons test. Data presented as means with SEM. Scale bar 50 μm in all images.

Summary of the molecular changes in the brains of zebrafish due to aging and/or the K115fs-like mutation (<italic>psen1</italic><sup>K97fs/+</sup>).

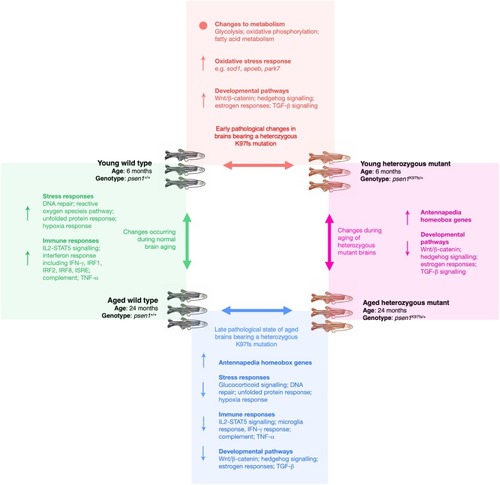
For each of the four pairwise comparisons shown, the summarised molecular changes (↑ = overall increased, ↓ = overall decreased, • = significant alterations but not in an overall direction) were inferred from a combination of the following analyses: functional enrichment analysis of differentially expressed genes and proteins, promoter motif enrichment analysis of differentially expressed genes, gene set enrichment analysis of differentially expressed genes, and weighted co-expression network analysis of the gene expression data.

Acknowledgments
This image is the copyrighted work of the attributed author or publisher, and ZFIN has permission only to display this image to its users. Additional permissions should be obtained from the applicable author or publisher of the image. Full text @ PLoS One