Amino acid sequence alignment of zebrafish ZNF143a vs. ZNF143b. Protein sequences of ZNF143a and ZNF143b were aligned with the lalign sequence analysis program using the algorithm of Huang and Miller [19]. Identical amino acids are indicated by a straight line, similar amino acids are indicated by a dotted line, and dissimilar amino acids are indicated by a single dot. Amino acids within the DNA binding domain are colored green, amino acids within the mRNA activation region are colored blue, and amino acids within the snRNA gene activation region are colored red

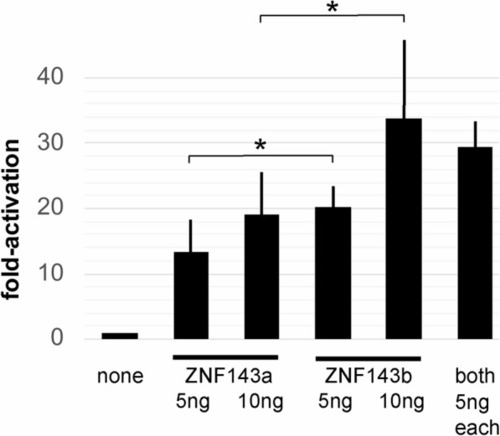
ZNF143a and ZNF143b exhibit similar transcriptional activation potential. Zebrafish ZF4 cells were transfected with pGL3-SPH5 firefly luciferase reporter gene plasmid, plus pRL-SV40 renilla luciferase reporter plasmid, and as noted, pCI-myczznf143a or pCI-myczznf143b expression vector plasmid. Relative luciferase expression was determined by comparing the firefly/renilla luciferase ratio for each sample to that ratio for the sample with addition of expression vector plasmid containing no gene. Bar height shows the mean value from independently transfected wells, and error bars report the standard deviation from the mean. The single asterisk denotes a significant difference (p < 0.05). As noted in a previous publication [16], we were unable to detect expression of the myc-tagged ZNF143 in ZF4 cells. Expression of ZNF143b in human HEK293 cells was somewhat higher than ZNF143a, and if representative of relative synthesis in ZF4 cells, could explain the greater transcriptional activation by ZNF143b in transient transfection experiments

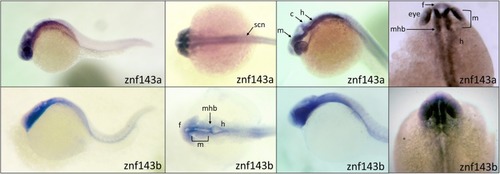
Similar spatial expression of
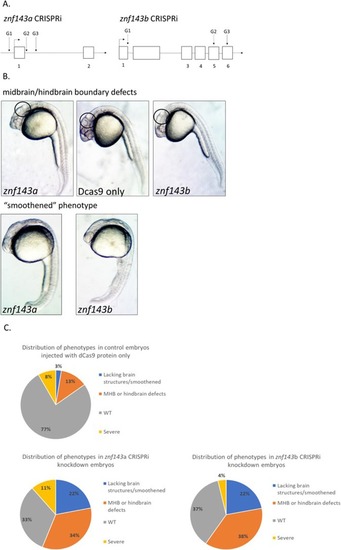
 znf143a and znf143b in 24hpf embryos. Antisense digoxigenin riboprobes against the znf143a and znf143b were used for whole-mount in situ hybridization assays. The probe for znf143b targeted the last exon of the coding region (approximately 186 nt corresponding to the last 61 amino acids) and the 3’UTR of the gene, while the probe for znf143a was designed solely against the 3’UTR. Embryos used were fixed and stained at 24hpf. The panels illustrate views from four different embryos for each probe, with the right-most panels showing an enlarged dorsal view of the head. We note that in all experiments, the znf143b probe produced fainter staining, most likely because of a smaller than optimal riboprobe that was necessary to ensure gene specificity. Specific head, brain and neural structures are identified with the following abbreviations: f, forebrain; m, midbrain; h, hindbrain; mhb, midbrain hindbrain boundary; c, cerebellum; scn, spinal cord neurons

EXPRESSION / LABELING:
Genes:
Fish:
Anatomical Terms:
Stage: Prim-5

znf143 paralog genes are differentially expressed in early development in zebrafish. cDNA was obtained from total RNA isolated from zebrafish embryos at either the shield, bud, 17-somite, or 24hpf stages. qPCR was performed for both znf143a and znf143b. Numbers on the y-axis represent the mean values for relative expression of each gene after normalization to the geometric mean of two housekeeping gene controls (ef1α and rpl13α), and comparison to the lowest value (znf143a at 17-somite stage). Error bars represent standard deviation from the mean. Statistically significant differences in expression levels are signified by the inclusion of p-values< 0.05, determined by Student’s t test

EXPRESSION / LABELING:
Genes:
Fish:
Anatomical Term:
Stage Range: Shield to Prim-5

CRISPRi knockdown of either znf143a or znf143b induce brain developmental defects. a. Diagram showing targets for sgRNAs. Numbered boxes indicate positions of exons. b. One-cell zebrafish embryos were injected with sgRNA/dCas9 protein complexes to knock down znf143a, znf143b, or in control experiments with dCas9 protein only (−sgRNA) and observed at 24hpf. Representative photographs of abnormal brain phenotypes are shown, with circled regions showing the areas of most interest. c. Consistent phenotypes are grouped into classes. Severe phenotypes lacked axial development. 159 embryos were counted for the control injections lacking any sgRNAs, 132 embryos were counted for the znf143a CRISPRi injections, and 136 embryos were counted for the znf143b CRISPRi injections

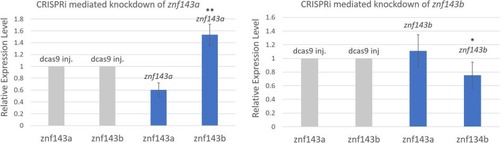
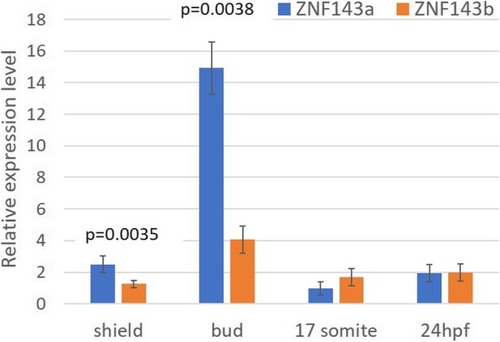
Analysis of specific gene knockdown in CRISPRi experiments. Quantitative RT-PCR was used to analyze relative levels of znf143a and znf143b transcripts. The amounts of each znf143 cDNA were determined relative to those in the dCas9 injection control after normalization to the geometric mean of the widely-expressed transcripts (ef1α and rpl13α). The height of each column represents the mean of 4 or 5 independent injection experiments, and error bars represent standard deviation from the mean. A single asterisk signifies a p-value < 0.05 relative to the control sample lacking any sgRNAs, while a double asterisk signifies a p-value < 0.01

Acknowledgments
This image is the copyrighted work of the attributed author or publisher, and ZFIN has permission only to display this image to its users. Additional permissions should be obtained from the applicable author or publisher of the image. Full text @ BMC Mol Cell Biol