
- Title
-
CEP41-mediated ciliary tubulin glutamylation drives angiogenesis through AURKA-dependent deciliation
- Authors
- Ki, S.M., Kim, J.H., Won, S.Y., Oh, S.J., Lee, I.Y., Bae, Y.K., Chung, K.W., Choi, B.O., Park, B., Choi, E.J., Lee, J.E.
- Source
- Full text @ EMBO Rep.
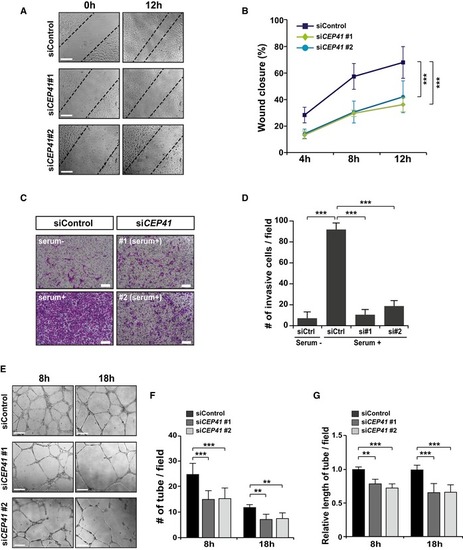
HUVECs transfected with control or The siRNA‐transfected HUVECs were plated inside a transwell chamber and incubated with serum for 18 h. The cells that invaded were observed after staining with crystal violet (CV) solution. Scale bars, 600 μm. The numbers of cells that invaded in each field of view were counted with the ImageJ software in (D). The data indicate the results of three independent experiments with ≥ 3 invasions per condition (mean ± SD). *** Tubulogenesis of control and |
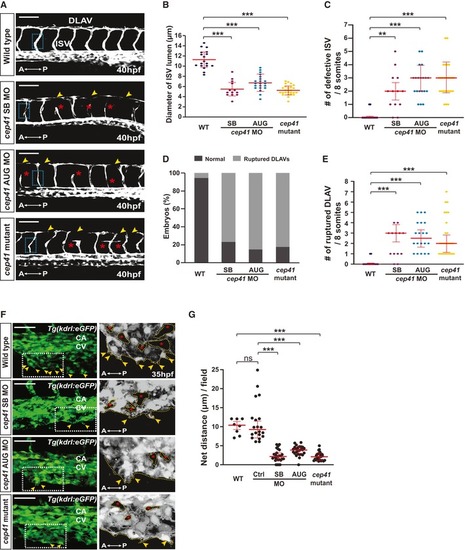
Blood vessels were observed in MOs (control, Quantification of ISV lumen diameter in (B), the numbers of defective ISVs in (C), the numbers of embryos with aberrant DLAVs in (D), and the numbers of ruptured DLAVs in (E) from data observed in equivalent fields of view (within eight somites). The severity of blood vessel defects in CV protrusions (arrowheads) and vascular loops (asterisks) were observed in zebrafish at 35 hpf. The images within the dotted rectangles are magnified in the right panels. A, anterior; P, posterior; CA, caudal artery; CV, caudal vein. Scale bars, 40 μm. Quantification of the length of the CV protrusions in (G) presented graphically by measuring them in equivalent fields of view (within five somites). Data are median of four independent experiments ( |

Control or Wild‐type and PHENOTYPE:
|

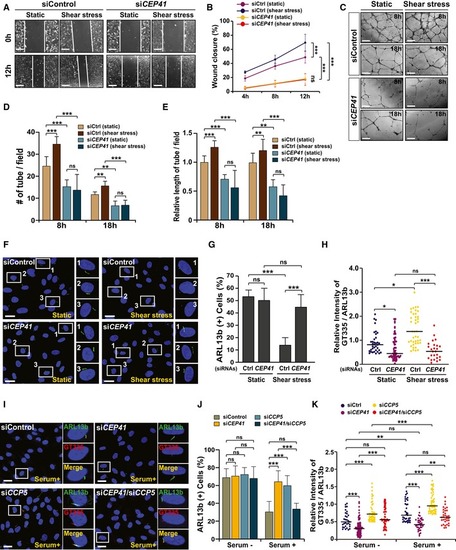
HUVECs transfected with The indicated siRNA‐transfected HUVECs were subjected to The blood vessels in the trunks of HUVECs co‐transfected with PHENOTYPE:
|
Control or An Control or Control, |
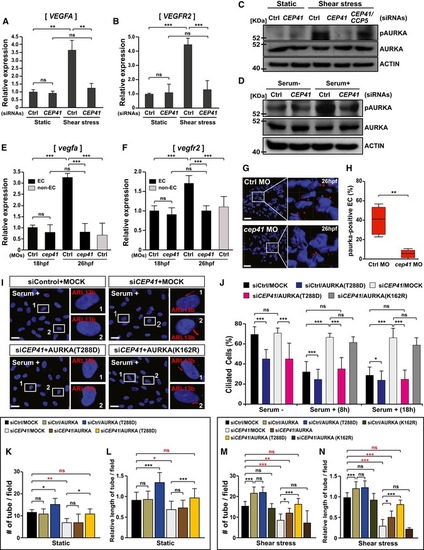
Immunoblot assays for phospho‐AURKA and AURKA were performed in HUVECs (C) and hTERT‐RPE1 cells (D) transfected with the indicated siRNAs. Protein levels were normalized against β‐actin in the same blots. The mRNA levels of zebrafish Control and EXPRESSION / LABELING:
PHENOTYPE:
|

The control or Zebrafish Control and |
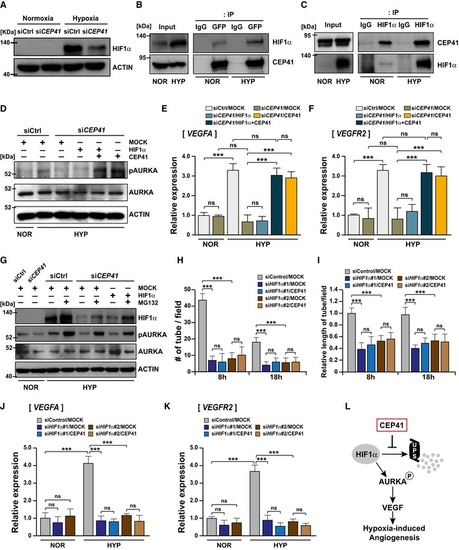
HUVECs transfected with control or Co‐immunoprecipitation assays using HIF1α‐ and CEP41‐specific antibodies were performed in HEK 293T cells expressing GFP‐CEP41 under normoxia or hypoxia. An IP using IgG‐specific antibodies was performed as a negative control. NOR, normoxia; HYP, hypoxia. The The Control or Quantification of tube node number in (H) and tube length in (I) from A schematic diagram showing the molecular mechanism by which CEP41 drives hypoxia‐induced angiogenesis. |
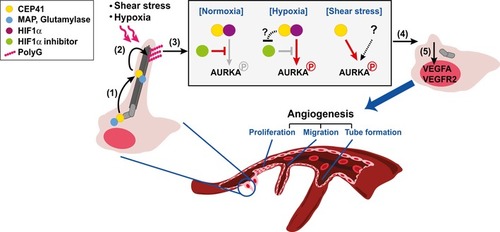
Overall proposed model for CEP41‐mediated angiogenesis |
Control or Wild‐type and |
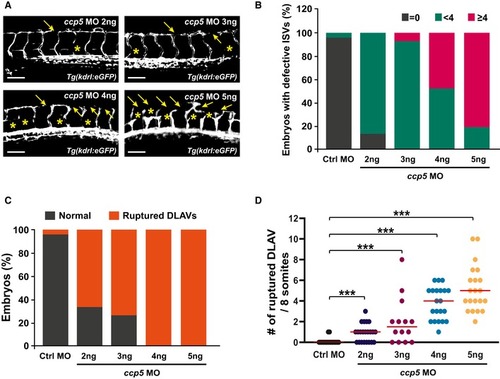
Blood vessels were observed in Quantification of the numbers of embryos with defective ISVs in (B), the numbers of embryos with aberrant DLAVs in (C), and the numbers of ruptured DLAVs in (D) from data observed in equivalent fields of view (within eight somites). Data are shown as median of three independent experiments with ≥ 20 embryos per condition. Statistical significance was determined using the Brown–Forsythe ANOVA followed by Dunnett's T3 |
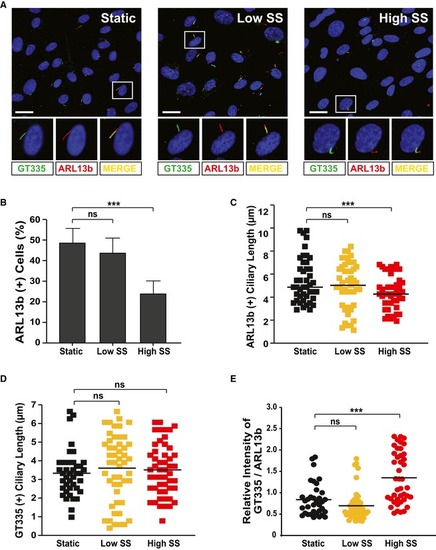
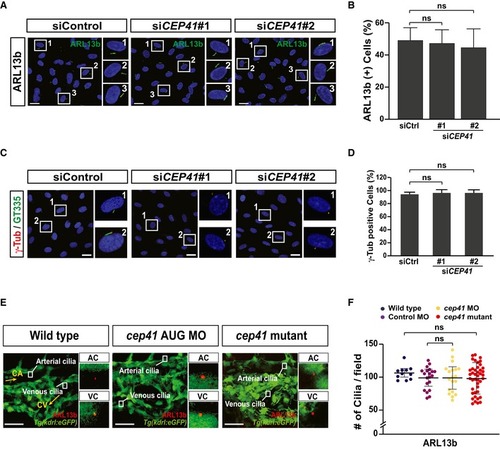
HUVECs were cultivated under either static, low, or high shear stress conditions and were immunostained with ARL13b‐ and GT335‐specific antibodies. Representative images indicated with rectangles appear in magnified images in the lower panels. Scale bars, 20 μm. Quantification of the numbers of ciliated cells (B), ciliary length (C, D), and relative intensity of GT335/ARL13b signals in the cilia (E) in images (A) is the result of three independent experiments with ≥ 200 cells per condition (mean ± SD or median). *** |
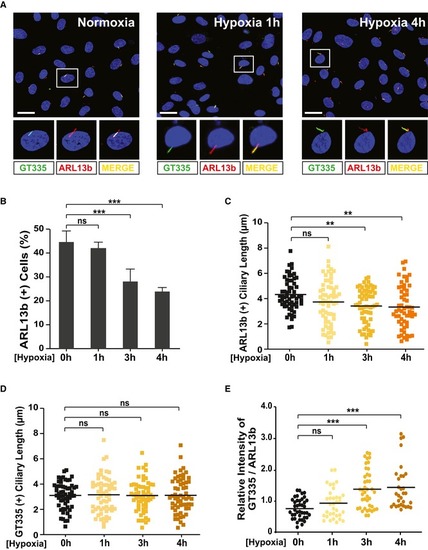
HUVECs were cultivated under either normoxia or hypoxia (short and long exposure) conditions and were immunostained with ARL13b‐ and GT335‐specific antibodies. Representative images indicated with rectangles appear in magnified images in the lower panels. Scale bars, 20 μm. Quantification of the numbers of ciliated cells (B), ciliary length (C, D), and relative intensity of GT335/ARL13b signals in the cilia (E) in images (A) is the result of three independent experiments with ≥ 200 cells per condition (mean ± SD or median). ** |
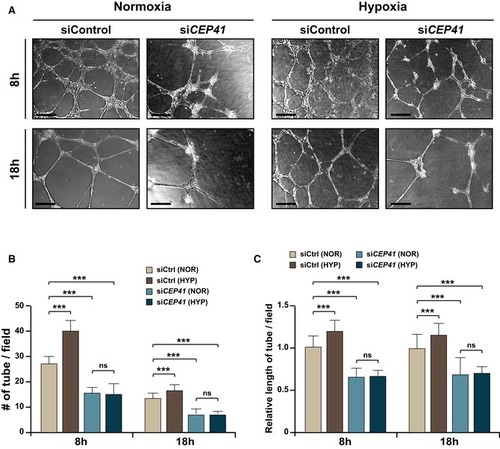
An Quantification of tube node number in (B) and tube length in (C) from data examined within equivalent fields of view at each time point using the ImageJ angiogenesis analyzer. Data are shown as mean ± SD of five independent experiments with ≥ 5 tubulogenesis regions per condition. Statistical significance was determined using the two‐way ANOVA followed by Tukey's |