FIGURE SUMMARY
Title

BMP2 Is Related to Hirschsprung's Disease and Required for Enteric Nervous System Development

Authors
Huang, S., Wang, Y., Luo, L., Li, X., Jin, X., Li, S., Yu, X., Yang, M., Guo, Z.
Source
Full text @ Front. Cell. Neurosci.

Low or no expression of BMP2 and GDNF in the spasm segment of Hirschsprung disease. (A) Western blot analysis of BMP2 and GDNF expression in normal colon and different segments of HSCR. (B) The density of BMP2/GDNF in different HSCR segments and normal colon. The protein expression of BMP2 in the spasm segment of HSCR is approximately 1/3 fold the density of distension segment of HSCR and normal colon (n = 3, t-test, P < 0.05, compared with normal colon and distension segment of HSCR); The protein expression of GDNF in the spasm segment of HSCR is approximately 1/4 fold the density of distension segment of HSCR and normal colon (n = 3, t-test, P < 0.05, compared with normal colon and distension segment of HSCR). (C) Immunohistochemistry was done to detect the expression of BMP2 in normal colon and different segments of HSCR. BMP2 was highly expressed in myenteric nerve plexuses of the normal colon (a) and distension segment of HSCR (b), but minimally expressed in the transitional segment (c), and spasm segment of HSCR (d) (black arrow: positive expression of BMP2 in ganglion cells). (D) Immunohistochemistry was done to detect the expression of GDNF in normal colon and different segment of HSCR. GDNF was strongly expressed in the endoderm but minimally expressed or absent in the nerve plexus (a,b) and the ectoderm of spasm segment (d). (E) Real-time PCR analysis of BMP2 and GDNF expression in normal colon and different segments of HSCR. The mRNA expression of BMP2 in the spasm segment of HSCR is approximately 1/3 fold of distension segment of HSCR and normal colon (n = 3, t-test, P < 0.05, compared with normal colon and distension segment of HSCR); The mRNA expression of GDNF in the spasm segment of HSCR is approximately 1/4 fold of distension segment of HSCR and normal colon (n = 3, t-test, P < 0.05, compared with normal colon and distension segment of HSCR). (F) PCR analysis of BMP2, GDNF, NGF, and BDNF expression in normal colon and different segments of HSCR. The expression of BMP2 and GDNF was decreased in the spasm segment of HSCR. The mRNA expression of BMP2 or GDNF in the spasm segment of HSCR is approximately 1/4 or 1/5 fold the density of distension segment of HSCR and normal colon (n = 3, t-test, P < 0.05, compared with normal colon and distension segment of HSCR); There is no significant difference in the density of mRNA expression in NGF and BDNF between the spasm segment of HSCR and the distension segment of HSCR and normal colon (n = 3, t-test, #P > 0.05, compared with normal colon and distension segment of HSCR); (black arrow: low or no expression of GDNF in ganglion cells; green arrow: positive expression of GDNF in the endoderm of normal colon and distension segment of HSCR; blue arrow: low expression of GDNF in the endoderm of spasm segment of HSCR).

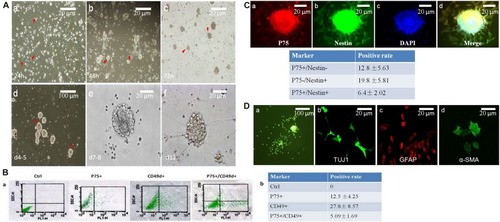
Neurospheres maintain the charactors for self-renewable and multipotent NCCs. (A) Primary neurospheres were formed at day 7-8(A,e). At 24 h, cells grew with adherence (A,a, red arrow head). After replating, tiny clusters can been seen at day 2 (A,b, red arrow head), which then became a dome (A,c, red arrow head) and neurospheres on day five (A,d, red arrow head). (B) Flow cytometry was used to detect the percentage of P75+ or CD49d+. The positive rate of P75+/CD49d+ was 5.09%. (C) The percentage of P75+/Nestin+ cells were 6.4%, which was detected by immunofluorescence. (D) Primary neurospheres were differentiated into neuron (TUJ1+), glial cells (GFAP+), and smooth muscle cells (α-SMA+).

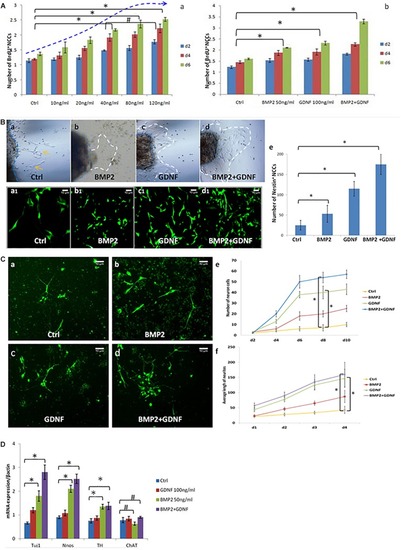
BMP2 promotes the proliferation migration and differentiation of NCCs. (A) BMP2 promote NCCs proliferation in a concentration-dependent manner. (A,a) Exposure to concentrations of BMP2 between 10 and 80 ng/ml for 2, 4, and 6 days significantly promoted NCC proliferation. There was no significant difference of NCC proliferation in the BMP2 concentration between 80 and 120 ng/ml (n = 3, 2-way ANOVA, P < 0.05, compared with ctrl; #P > 0.05, compared with 40 ng/ml group); (A,b) BMP2 and GDNF significantly promoted NCC proliferation (n = 3, 2-way ANOVA, P < 0.05, compared with ctrl). (B) Both BMP2 and GDNF promote migration of Nestin+ NCCs. Cells were treated with DMSO, GDNF, BMP2, or both GDNF and BMP2 for 2 days. Compared with control group (B,a,a1), there were more Nestin + NCCs migrating into the collagen gel (B,b,b1,c,c1,d,d1); (B,e) Values are given as mean ± SE. n = 3, t-test, P < 0.05, compared with control. (C) Immunofluorescence images showing primary enteric neurons (Tuj1+) cultured when treated with GDNF, BMP2, or both. Cells were treated with DMSO, GDNF, BMP2, or both GDNF and BMP2 for 2 days. Primary enteric neurons were labeled with Tuj1. (C,e) The number of neuron cells were counted. Values are given as mean ± SE. n = 3, 2-way ANOVA, P < 0.05, compared with ctrl. (C,f) The average length of neuritis were measured. Values are given as mean ± SE. n = 3, 2-way ANOVA, P < 0.05, compared with ctrl. (D) Real time-PCR was done by using RNA from NCCs treated with GDNF, BMP2, or both GDNF and BMP2 for 48 h and probed for different genes. A clear increase in TUJ1 expression was noted in cells cultured in the presence of BMP2 or GDNF. BMP2 also promoted the expression of nNOS and catecholaminergic neurons (TH expression) but had no effect on the expression of ChAT. Values are given as mean ± SE, n = 3, t-test, P < 0.05, compared with BMP2 and BMP2 + GDNF treatment group; #P > 0.05, compared with BMP2 and BMP2 + GDNF treatment group.

BMP2b is required for normal ENS and intestinal smooth muscle development. (A,a,c,e;B,a,b,e;C,a,b,e,f,g) wild-type embryos, (A,b,d,f;B,c,d,f;C,c,d,h,i,j) BMP2b MO embryos. (A,b) Dorsal viewing for the vagal region of 36 hpf embryos hybridized with crestin probe showed a defective vagal NCC migration to the anterior end of the intestine in BMP2MO morphants(26/37, 70.3%). (A,d,f) Lateral view of 60 hpf embryos hybridized with phox2b probe showing a failure of precursors migration to the anterior of the intestine in BMP2MO morphants(26/34, 76.5%). (B,c,d) Immunofluorescence showed the developmental defect of intestinal smooth muscle in the intestine of BMP2b MO embryos(22/30, 73.3%). (B,f) Lateral view of the intestine for 72 hpf embryos hybridized with α-SMA showing a reduce of α-SMA expressing in the intestine of BMP2b MO embryos(31/39, 79.5%). (C,c,d,h,i,j) Lateral and transverse view the vagal region of 34 hpf embryos labeled with GFP for foxd3 showed a failure of vagal NCC migration in BMP2MO morphants(29/36, 80.5%). (D) BMP2 overexpression results in an increase in enteric neurons. Lateral views of phox2b in enteric ganglia of 72 hpf control (D,a) and HS embryos (D,b). (D,c) Bar graph summarizes the results from one of three independent BMP2 HS experiments (six zebrafish in different groups). The phox2b expressing cells in the HS group is approximately 1.5 fold of ctrl group (n = 6, t-test, P < 0.05, compared with ctrl group). (E) BMP2b is necessary to maintain the anterior-posterior axis of embryos display and liver development. (a) control embryos(114/120, 95%). (b) BMP 2b MO treated embryos that have the anterior–posterior axis of embryos displayed defect(43/60, 71.7%). (c) control embryos(68/80, 85%). (d) BMP2b MO treated embryos, the liver became smaller on day 3(51/76, 67.1%). Bar, 100 μm. Notice: here “26/37” means 26 out of the 37 embryos had defective NCC migration like in the image showed. The following statistical numbers for embryos like this have the same meaning in the Figure legends. Blue arrows (A) indicate the migrating enteric precursors. White arrowheads (A) indicate phox2b expressing cells in the intestine. Asterisk (B) indicate gut. Yellow arrowheads (C) indicate vagal region. White arrows (C) indicate the migrating enteric precursors.

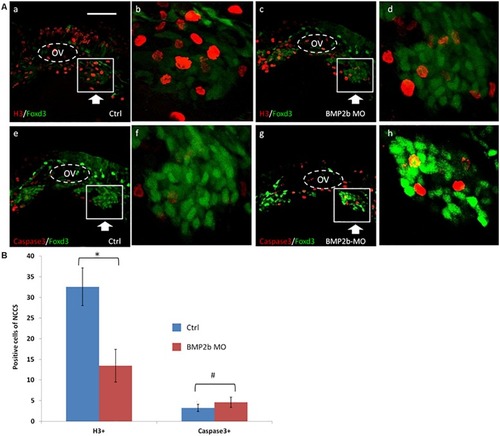
Proliferation but not apoptosis was changed in vagal NCC and ENS NCC in BMP2b morphants. Here we selected the areas included in the squares to count the positive cells, and the square areas were magnified on the right side of each image. (A,b,f) Lateral views of the vagal region of 30 hpf wild type(11/11, 100%)and (A,d,h) BMP2b MO treated (29/33, 87.9%)Foxd3:GFP transgenic embryos. Embryos were double stained with anti gfp (green) to study the distribution of vagal NCC and ENS NCC’s, anti caspase 3 (red) (A,e,h) to confirm apoptotic cells and, anti phosphohistone H3 (red) (A,a,d) to reveal proliferating cells. OV means otic vesicle. Large arrowheads pointed to the stream of vagal NCC. White boxes include the region that is shown in close up in the insert. Small white arrowheads point to the proliferating cells. (B) The NCC proliferation in the ctrl group is approximately 2.3 fold the H3+ cells of BMP2b MO group. The NCC apoptosis in the ctrl group is approximately 0.87 fold the Caspase3+ cells of BMP2b MO group. Values are given as mean ± SE. n = 6, t-test, P < 0.05, compared with BMP2b MO group; #P > 0.05, compared with BMP2b MO group. Bar, 100 μm.

BMP2 function are required for differentiation of neurons. (A) Lateral views of the vagal region of 72 hpf wild type(15/15, 100%) (A,a) and BMP2b MO treated(32/39, 82.1%) (A,b). Embryos were immunocytochemically double stained with anti Hu antibody (red) and anti Tuj1 antibody (green) (Yellow dashed lines indicate the gut). (B) Partition diagram of zebrafish gut. The gut was divided into five areas, the number of neurons of section III were counted (Sb, swim bladder; Ph, pharynx; E, esophagus). (C) The number of neurons was counted in different groups. The number of neurons in the ctrl group is approximately 7.8 fold the Hu+ cells of BMP2b MO group. The number of neurons in the ctrl group is approximately 14.6 fold the Tuj1+ cells of BMP2b MO group. Values are given as mean ± SE. n = 6, t-test, P < 0.01, compared with ctrl group.

PHENOTYPE:
Fish:
Knockdown Reagent:
Observed In:
Stage: Protruding-mouth

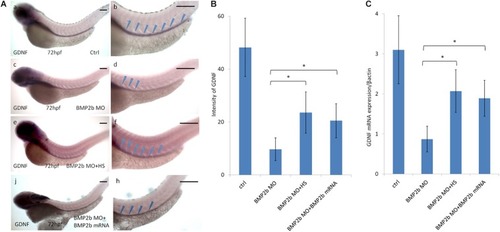
Expression of GDNF in the intestinal mesenchyme requires BMP2 signaling. (A,a,b) control embryos(97/103, 94.2%), (A,c,d) BMP 2b MO treated embryos) lateral views of 72 hpf whole mount embryos(112/124, 90.3%) that have been hybridized with a gdnf antisense probe. Compared with the control group, there is only partial expression of GDNF at the anterior end of the intestine at this age. (A,e,f) BMP2b MO plus heat-shocked at 10 hpf(84/105, 80%), the expression of GDNF was partly rescued. (A,j,h) BMP2b MO plus BMP2b mRNA were co-injected, the expression of GDNF was partly rescued(84/105, 80%). (B) The intensity of GDNF expression in different group. The expression of GDNF mRNA in the BMP2b MO group is approximately 2.7 fold the intensity of BMP2b MO + HS group. The expression of GDNF mRNA in the BMP2b MO group is approximately 2.5 fold the intensity of BMP2b MO + BMP2b mRNA group. Values are given as mean ± SE. n = 6, t-test, P < 0.05, compared with BMP2b MO + HS group or BMP2b MO + BMP2b mRNA group.) (C) Real time PCR analysis of GDNF mRNA expression. The GDNF mRNA expression was rescued in BMP2b + HS group, n = 6, t-test, P < 0.05, compared with BMP2b MO group. Bar, 100 μm.

EXPRESSION / LABELING:
Gene:
Fish:
Condition:
Knockdown Reagent:
Anatomical Term:
Stage: Protruding-mouth
PHENOTYPE:
Fish:
Condition:
Knockdown Reagent:
Observed In:
Stage: Protruding-mouth

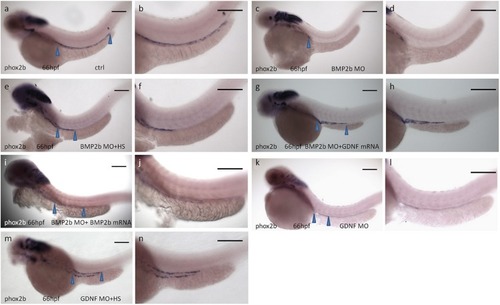
Rescue of BMP2-MO and GDNF-MO phenotypes by heat shock induced BMP2 using Tg(Hsp70:bmp2b-GFP) embryos, as well as by injecting BMP2b mRNA or GDNF mRNA. (a,b) Representative image of 66 hpf embryos obtained from control injection(78/84, 92.8%), (c,d) injection with BMP2b-MO alone(115/151, 76.2%) or (e,f) with BMP2b-MO plus heat-shocked at 10 hpf(120/146, 82.2%) or (g,h) with GDNF mRNA(110/153, 71.9%) or (i,j) with BMP2b mRNA (63/76, 82.9%), (k,l) injection with GDNF-MO alone(115/138) or (m,n) with GDNF-MO plus heat-shocked at 10 hpf(105/125, 84%). Arrowheads indicate phox2b expressing in the intestine. Bar, 100 μm.

EXPRESSION / LABELING:
Gene:
Fish:
Condition:
Knockdown Reagents:
Anatomical Term:
Stage: Pec-fin
PHENOTYPE:
Fish:
Condition:
Knockdown Reagents:
Observed In:
Stage: Pec-fin
Acknowledgments
This image is the copyrighted work of the attributed author or publisher, and ZFIN has permission only to display this image to its users. Additional permissions should be obtained from the applicable author or publisher of the image. Full text @ Front. Cell. Neurosci.