FIGURE SUMMARY
Title

A morphogenetic EphB/EphrinB code controls hepatopancreatic duct formation

Authors
Thestrup, M.I., Caviglia, S., Cayuso, J., Heyne, R.L.S., Ahmad, R., Hofmeister, W., Satriano, L., Wilkinson, D.G., Andersen, J.B., Ober, E.A.
Source
Full text @ Nat. Commun.

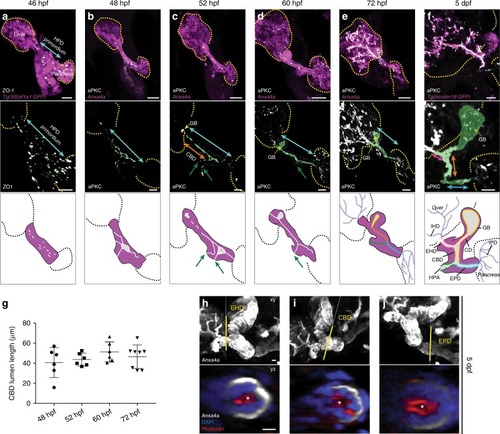
The HPD system forms by de novo tubulogenesis. a The forming HPD is visualized by pan-endodermal Tg(Xla.Eef1a1:GFP) (magenta) and ZO-1 (gray) labels the first junctional aggregates in the HPD primordium (blue arrow) at 46 hpf. b Ductal endoderm expression of Anxa4 (magenta) and apical aPKC (gray) visualize HPD morphology and nascent microlumina within the prospective CBD and EPD (n = 17, N = 3). c The HPD system elongates and the gallbladder anlage (yellow arrow) becomes detectable at 52 hpf. The immature EHB and HPA lumina show gaps and luminal loops compared to the EPD exhibiting a continuous immature lumen (n = 21, N = 3). The HPA connects at two points (green arrows). d At 60 hpf, all ductal compartments and a sphere-like gallbladder display a continuous emerging lumen, including a single connection of the HPA (green arrow), but excluding the EHD (n = 29, N = 2). See also Supplementary Movie 1. e Along organ growth, the HPD tubes start bending from 72 hpf. The emerging lumen formed in the HPD system is continuous and connected to both IHD and IPD luminal network (n = 11, N = 2) f transgenic keratin18:GFP expression visualizes the compact EHB and IHD at 5 dpf (n = 13, N = 4), see also Supplementary Movie 8. Schematic overviews of HPD differentiation (af): starting with junctional aggregates and resulting in a continuous lumen spanning the HPD system. From 52 hpf individual HPD compartments are distinguishable: extrahepatic duct (EHD, pink); cystic duct (CD, red); gallbladder (GB, yellow); common bile duct (CBD, orange); extrapancreatic duct (EPD, blue); hepatopancreatic ampula (HPA, green). Scale bars: af = 10 μm. g Lumen length quantification of the differentiating CBD between 48 and 72 hpf. hj At 5 dpf, cortical actin indicates open lumina in the wild-type EHD, CBD and EPD; scale bars = 10 μm. Magnified cross-sections show open lumina (asterisk) of indicated ductal domains (yellow lines); scale bars = 5 μm. Error bars show SEM; n = sample number, N = number of experiments. Source data are provided as a Source Data file

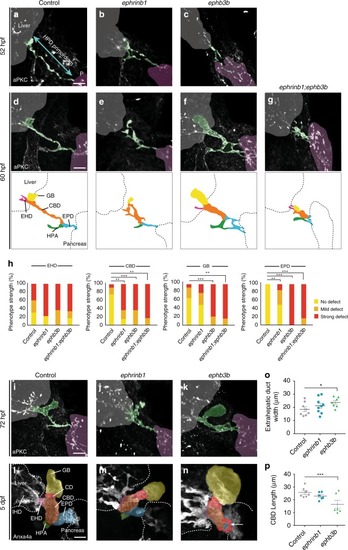
EphrinB1 and EphB3b control HPD remodeling in a spatiotemporal fashion. Compared to sibling controls at 52 hpf (a), emerging ducts are less mature in ephrinb1 mutants with more disconnected luminal pockets in EHB and HPA, visualized by apical aPKC (white, n = 16, N = 3) (b). c HPD luminal pockets are similarly disrupted in ephb3b mutants at 52 hpf, including the EPD (n = 17, N = 2). d Disconnected apical structures resolve into a single immature lumen by 60 hpf in controls (n = 29, N = 2). e Disrupted remodeling causes enlarged aPKC structures and luminal loops in all EHB domains in ephrinb1 mutants, while the EPD appears normal (n = 20, N = 2). f Resolution of apical structures in ephb3b mutants is compromised in all HPD domains, including the EPD (n = 12, N = 1). g All HPD domains exhibit defective tube remodeling in ephrinb1;ephb3b mutants (n = 7). Schematics (df) show HPD tube phenotypes at 60 hpf, see below for domain color-code. h Quantification of domain-specific HPD tube formation defects in controls (n = 12), ephrinb1 (n = 14), ephb3b (n = 14) and ephrinb1;ephb3b (n = 7) mutants at 60 hpf. in Early domain-specific defects persist in ephrinb1 and ephb3b mutants at 72 hpf (ik; controls: n = 11, N = 2; ephrinb1: n = 5; ephb3b: n = 12, N = 1) and 5 dpf (ln; control: n = 10, N = 2; ephrinb1: n = 6, N = 1; ephb3b: n = 10, N = 1). 30% ephb3b mutants show in addition ectopic ducts (red; white arrow) bifurcating from the main HPD. Quantification of EHD width (o) and CBD length (p) in ephrinb1 and ephb3b mutants at 5 dpf. ln Anxa4 (gray) visualizes the HPD system at 5 dpf. HPD domains are color-coded based on morphological landmarks (e.g., HPA): EHD = pink; CD = red; gallbladder = yellow; CBD = orange; EPD = blue; HPA = green. Scale bar = 20 μm; n = sample number, N = number of experiments; Statistical test: h = Fisher Exact, o, p = Student’s t-test. Errors bar show SEM; *p < 0,05, ***p < 0,001. Liver and pancreas stainings for af and ik are shown in Supplementary Fig. 2. Supplementary movies 14 and 810 show HPD phenotypes at 60 hpf and 5 dpf. Source data are provided as a Source Data file

Ductal cell rearrangement and lumen resolution require EphrinB1 and EphB3b. ad Overview of the forming HPD epithelium by maximum projection of confocal stacks stained for PanCadherin (magenta) aPKC (white) in control and ephrinb1 and ephb3b mutants. Blue dashed squares indicate magnified CBD containing areas. a At 48 hpf, PanCadherin shows multiple cell layers in CBD (e.g., colored cells 1–3). b By 60 hpf, the CBD is largely a single-layered epithelium with apical domains facing the central lumen. c, dephrinb1 and ephb3b CBDs show disrupted epithelial organization, including luminal loops, with cells with multiple or extended apical domains (yellow arrowheads), and teardrop shaped-cells with reduced apical domains (white arrowhead). e Quantification of the longest continuous aPKC staining as a measure for CBD lumen elongation in controls, ephrinb1 and ephb3b mutants between 52 and 60 hpf. f Basal/apical membrane ratio was used to quantify CBD cell shapes in control (n = 26 cells), ephrinb1 (n = 28) and ephb3b (n = 28) embryos at 60 hpf. g Quantification of CBD cell height (distance between apical and basal membranes) in control (n = 26 cells), ephrinb1 (n = 28) and ephb3b (n = 28) embryos at 60 hpf. Scale bars: a = 5 μm, bd = 20 μm. Statistical test: e, g = Student’s t-test, f = Fisher Exact. Errors bar show SEM; **p < 0,01, ***p < 0,001. Source data are provided as a Source Data file

HPD differentiation requires EphrinB1-controlled actomyosin contractility. a Experimental scheme for 65 μM blebbistatin incubation during HPD remodeling from 52–60 hpf. bd Blebbistatin-treated embryos show two types of EHB epithelial defects: c extensive luminal loops (45.5%, n = 11, N = 2) and d gaps in the emerging apical lumen (45.5%, n = 11, N = 2; and 9% wild-type like). The nascent EPD lumen is mostly resolved, consistent with the treatment window; scale bars = 15 μm. PanCadherin staining (magenta) of magnified views of CBD (red dashed box) shows rounder epithelial cells (red arrowheads), a multi-layered configuration with loops and cells exhibiting extended apical domains (green arrowheads) or gaps and cells with multiple apical domains (blue arrowhead) in treated embryos compared to controls; scale bars = 5 μm. e Quantification of CBD length shows significant increase upon blebbistatin treatment compared to controls. f, g Actin, pMLC and ZO-1 localize apically (white arrowheads) in the forming CBD; whether pMLC is at the apical membrane and/or the junctional belt cannot be distinguished. pMLC is at the duct mesoderm border (yellow arrowheads) and lower levels at the lateral membrane (orange arrowheads) 60 hpf; scale bars = 5 μm. h Quantification of apical pMLC expression in CBD cells of 60 hpf control (n = 3) and ephrinb1 embryos (n = 3). For quantification strategy see Supplementary Fig. 5. Statistical test: e, h = Student’s t-test. Error bars show SEM; *p < 0,05, ***p < 0,001. Source data are provided as a Source Data file

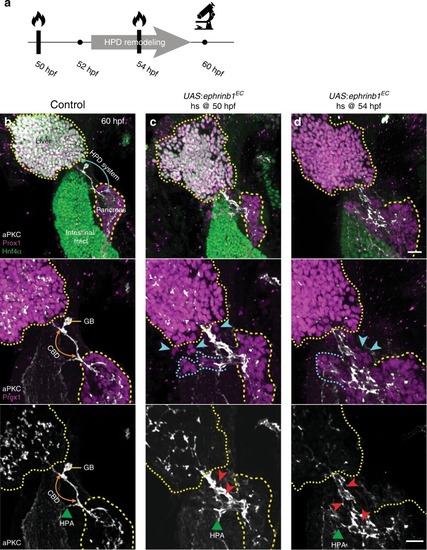
EphB/EphrinB signaling controls HPD lumen morphogenesis independently of other morphogenetic roles. a Conditional ephrinb1EC expression is induced by heat-shock prior to or during CBD remodeling, at 50 hpf or 54 hpf, respectively. Embryos were analysed at 60 hpf (heat-shock at 50 hpf: n = 7, heat-shock at 54 hpf: n = 7, both N = 1). bd Hnf4α (green), Prox1 (magenta) and aPKC (gray) labeling show that unlike in controls (b), conditional ephrinb1EC expression at 50 hpf (c) and 54 hpf (d) leads to HPD, liver and pancreas morphology defects, ectopic Prox1-positive cells throughout the HPD (blue arrowheads), with a subset associated with ectopic lumina bifurcating from the main duct (outlined with blue dashed line) disrupted and disorganized HPD lumen (red arrowheads, c, d). Yellow dotted lines: liver, yellow dashed line: pancreas; blue arrow: HPD system, orange arrow: CBD, green arrowhead: HPA

Regionalized HPD endoderm and mesoderm expression of multiple EphrinBs and EphBs. a At 48 hpf, EphrinB1 is strongly expressed in the liver and at lower levels in the HPD primordium close to the liver. EphB3b expression is high in the pancreas and in the HPD primordium close to the pancreas and lower close to the liver, as well as very low in the HPD-adjacent mesoderm; pan-endodermal tg(Xla.Eef1a1:GFP) highlights the digestive system. b At 52 hpf, EphrinB1 is expressed in the liver (yellow dotted line) and EHB (white arrow), while EphB3b is highly expressed in the pancreas (yellow dotted line) and at low levels in the EPD (white arrow) and HPD mesenchyme (white arrowheads). c EphrinB2a and EphB4a are co-expressed in the gallbladder (white dashed line). EphrinB2a is present in the posterior region of the swim bladder. EphB4a is in the mesenchyme along the gut tube and around the swim bladder. Scale bar = 30 μm

EphrinB2a and EphB4 functions in gallbladder and CBD formation. Unlike sibling controls (a), ephrinb1 mutants (b) show disrupted ducts in the EHB region. ephrinb2a mutants (c) exhibit dysmorphic gallbladder and CBD (46.1% show the full phenotype, 53.9% show milder phenotype, n = 13, N = 2). dephrinb1;ephrinb2a double mutants show additive EHB duct defect (100% n = 8, N = 1). eephb4a mutants show no apparent HPD defect (n = 4, N = 1). Schematics of immature HPD lumina show in a-e in domain-specific color code. f Quantification of ephrinb1, ephrinb2a, ephb4a and ephrinb1; ephrinb2a double mutant HPD formation defects at 60 hpf, scored for individual HPD domains (control: n = 12; ephrinb1: n = 14; ephrinb2a: n = 10; ephb4a: n = 4, ephrinb1;ephrinb2a: n = 8); see Supplementary Fig. 3 for averaged scores from two assessors. gk Early duct morphogenesis defects cause dysmorphic HPD appearance at 5 dpf in ephrinb1, ephrinb2a and ephrinb1;ephrinb2a double mutants, while the HPD in ephb4a mutants appears control-like. (control: n = 10, N = 2; ephrinb1: n = 6, N = 1; ephrinb2a: n = 7; ephrinb1;ephrinb2a: n = 6; ephb4a: n = 2) l Area quantification shows the gallbladder is significantly smaller in ephrinb1; ephrinb2a double mutants at 5 dpf. m Quantification of CBD length at 5 dpf shows significant differences in ephrinb2a and ephrinb1;ephrinb2a mutants. np In contrast to controls (n), fewer EphrinB2a-positive gallbladder precursors form in ephb4a mutants at 52 hpf (o). p Quantification of liver and gallbladder progenitor numbers (control and ephb4an = 10). a-e: Scale bar = 15 μm, gk = 20 μm. Statistical test: f= Fisher Exact, l, m, p = Student’s t-test. Error bars show SEM; *p < 0,05; **p < 0,01; ***p < 0,001. Supplementary movies 1, 2, 59, 1113 show HPD phenotypes at 60 hpf and 5 dpf. Source data are provided as a Source Data file

An EphB/EphrinB code and myosin II contractility control HPD tubulogenesis. a Graphic representation of domain-specific phenotypes observed in ephrinb1, ephrinb2a, ephb3b and ephb4a mutants; y-axis indicates overall severity of phenotypes. b Graphic representation of domain-specific expression of EphrinB1, EphrinB2a, EphB3b and EphB4a in HPD endoderm and surrounding mesoderm at 52 hpf. c Working model of HPD de novo lumen formation focused on the CBD domain. Lumen formation occurs by a multi-step cord hollowing mechanism, which starts with scattered junctional aggregates, transitions through apical/luminal pocket formation and their subsequent coalescence and finally resolves into a single lumen. Apical/luminal pocket coalescence is promoted by ductal EphrinB1/EphrinB2a interaction with mesodermal EphB3b at the tissue interface and actomyosin contractility

Acknowledgments
This image is the copyrighted work of the attributed author or publisher, and ZFIN has permission only to display this image to its users. Additional permissions should be obtained from the applicable author or publisher of the image. Full text @ Nat. Commun.