
- Title
-
Distinct origins and molecular mechanisms contribute to lymphatic formation during cardiac growth and regeneration
- Authors
- Gancz, D., Raftrey, B.C., Perlmoter, G., Marín-Juez, R., Semo, J., Matsuoka, R.L., Karra, R., Raviv, H., Moshe, N., Addadi, Y., Golani, O., Poss, K.D., Red-Horse, K., Stainier, D.Y., Yaniv, K.
- Source
- Full text @ Elife
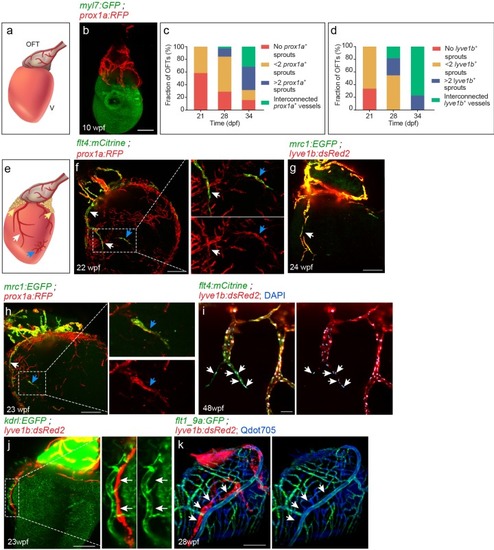
(a) Diagram of ~7 wpf zebrafish heart depicting the outflow tract (OFT), ventricle (V) and lymphatics (red). (b) At 10 wpf (fish size 16–24 mm) prox1a-labeled collecting lymphatics are clearly detected in the OFT, but absent on the ventricular surface (n = 9). (c,d) Quantification of 21–34 dpf (fish size 7–14 mm) OFT lymphatic development in prox1a (c) (n21dpf=48, n28dpf=38, n34dpf=19) andlyve1b (d) (n21dpf=12, n28dpf=11, n34dpf=13) transgenic zebrafish. (e) Diagram of adult zebrafish heart depicting ventricular lymphatics (white arrows), fat-associated lymphatics (yellow arrows) and isolated lymphatic clusters (blue arrows). OFT and ventricular lymphatics as well as isolated lymphatic clusters in 22–24 wpf (fish size 25–30 mm) are labeled by the flt4 (f), lyve1b (g), prox1a (f,h) and mrc1a (g,h) (nf = 4, ng = 5, nh = 5) transgenic reporters. (i) 1–5 cells at the tip of ventricular lymphatics are labeled primarily by the flt4 transgene (arrows). Nuclei are labeled by DAPI (blue) (48wpf, fish size 25–30 mm, n = 5). (j) Ventricular lymphatics are not labelled by the blood vessel/endocardial- marker Tg(kdrl:nls-mCherry) (23wpf, fish size 25–30 mm, n = 5). (k) Angiogram of 28 wpf (fish size 28 mm) Tg(flt1_9a_cFos:GFP);Tg(lyve1b:dsRed2) heart. Cardiac lymphatics (arrows) are not labeled following intravascular injection of Qdot705 (blue) (n = 6). Scale bars are 200 µm in b, f-h, j, k; 50 µm in i. Posterior view in b, anterior view in f-k. EXPRESSION / LABELING:
|
( |
OFT of 8 wpf (fish size 14–24 mm) ( |
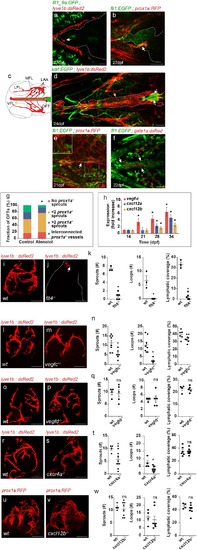
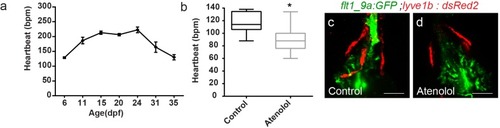
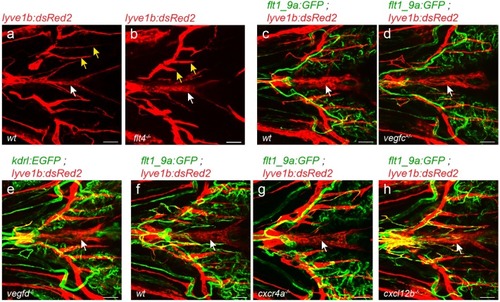
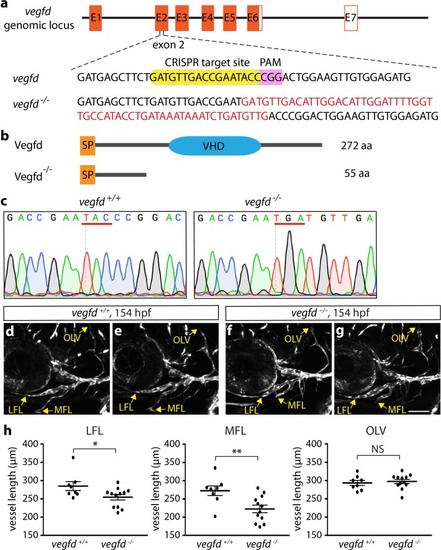
(a–b) Blood vessels are not detected in the OFT (outlined) of 21–28 dpf (fish size 5–7 mm) (a) Tg(flt1_9a_cFos:GFP); Tg(lyve1b:dsRed2) hearts (n = 6) or (b) Tg(fli1:EGFP);Tg(prox1a:KalTA4-UAS:uncTagRFP) (n = 4) fish, prior to OFT lymphatic sprouting (white arrows). (c) Diagram depicting a ventral view of a zebrafish larval head, indicating the approximate region imaged in (d-f). Facial lymphatics are colored in red (adapted from Okuda et al., 2012), yellow arrow points to the VFL. (d) OFT lymphatic sprouts (white arrows) arising from the VFL (outlined, yellow arrow) are detected at 24 dpf (Fish size 5–7 mm) in Tg(kdrl:EGFP);Tg(lyve1b:dsRed2);casper larvae (n = 5). (e) The VFL (arrow) connects to the LAA (inset). (f) No blood flow is detected in the VFL (arrows) of 22 dpf (fish size 5—7 mm) Tg(fli:EGFP);Tg(gata1a:dsRed2) larvae (n = 10). (g) Quantification of OFT lymphatics in 35 dpf (fish size 9–13 mm) prox1a transgenic zebrafish treated with 100 µM Atenolol (ncontrol = 43, nAtenolol = 43, *p<0.001). (h) mRNA levels of vegfc, cxcl12a and cxcl12b (nindependent experiments=5, *p<0.01) in the OFTs of 14–34 dpf larvae. (i–k) OFT of 19 wpf (22–25 mm) wt sibling (i) and flt4-/- (j) in the background of lyve1b demonstrating severe lymphatic defects in flt4 -/- hearts, quantified in (k) (nwt = 4, nflt4 -/-=5, *p<0.001). (l–n) OFT of 15 wpf (20–21 mm) wt sibling (l) and vegfc +/- (m) in the background of lyve1b showing malformed lymphatics in vegfc +/-, quantified in (n) (nwt = 8, nvegfc+/-=6, *p<0.01, **p<0.05). (o–q) OFT of 12 wpf (19–21 mm) age-matched wt control (o) and vegfd -/- (p) in the background of lyve1b showing normal OFT lymphatics in vegfd -/- hearts, quantified in (q) (nwt = 4, nvegfd-/-=5) (r–t) OFT lymphatics of 9.5 wpf (20–23 mm) wt sibling (r) and cxcr4a-/- (s) in the background of lyve1b showing mild defects in cxcr4a-/- OFT lymphatics, quantified in (t) (nwt = 4, ncxcr4a-/-=10, *p<0.01). (u–w) OFT lymphatics of 20 wpf (19–24 mm) wt sibling (u) and cxcl12b-/- (v) in the background of prox1a showing normal OFT lymphatics in cxcl12b-/- hearts, quantified in (w) (nwt = 4, ncxcl12b -/-=8). VFL, ventral facial lymphatics; LFL, lateral facial lymphatic; LAA, lymphatic branchial arches; MFL, medial facial lymphatic. Scale bars are 50 µm in a-f, 200 µm in i-v. Error bars, mean ± S.E.M. |
( |
( PHENOTYPE:
|
( |
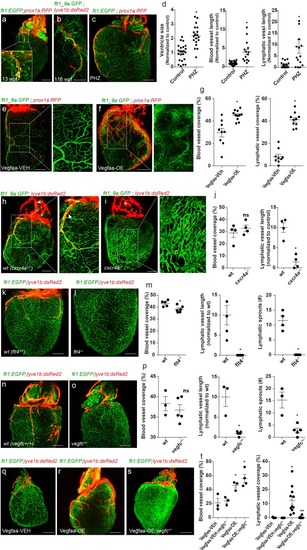
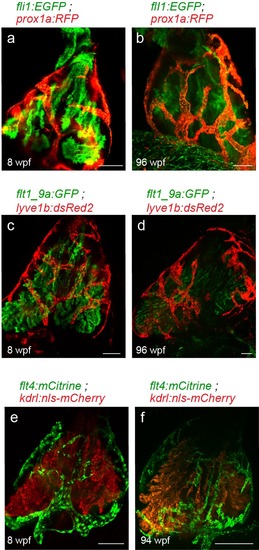
Insets are magnifications of dashed boxes. (a) 13 wpf (fish size 17 mm) Tg(fli1:EGFP);Tg(prox1a:KalTA4-UAS:uncTagRFP) hearts showing ventricular lymphatic sprouting at the base of the OFT (inset) (n = 11). (b) Ventricular lymphatics grow in close proximity to coronary arteries (inset) in 116 wpf (fish size 25–32 mm) Tg(flt1_9a_cFos:GFP);Tg(lyve1b:dsRed2) hearts (n = 15). (c) Heart of 11wpf (fish size 16–22 mm) Tg(fli1:EGFP);Tg(prox1a:KalTA4-UAS:uncTagRFP) fish treated with 100 µg/ml Phenylhydrazine hydrochloride (PHZ), showing increased ventricle size and total length of blood and lymphatic vessels following PHZ treatment, quantified in (d) (ncontrol = 21, nPHZ = 15, *p<0.005). (e,f) 12 wpf (fish size 19–22 mm) Tg(βactin2:loxP-mTagBFP-STOP-loxP-vegfaa)pd262; Tg(cmlc2:CreER) fish in the background of Tg(flt1_9a_cFos:GFP);Tg(prox1a:KalTA4-UAS:uncTagRFP). Induction of Vegfaa-OE results in increased blood vessel (insets) and lymphatic vessel coverage, as compared to vehicle (Vegfaa-VEH) treated sibling control, quantified in (g) (nVegfaa-VEH = 9, nVegfaa-OE = 10, *p<0.001). (h–j) Immature coronary plexus, lacking the stereotypical tree-patterning results in nearly absent ventricular lymphatics in cxcr4a-/- hearts of 22 wpf (fish size 25–28 mm) (i), as compared to wt siblings (h), quantified in (j) (nwt = 5, ncxcr4a-/-=6, *p<0.05). (k–m) Ventricular lymphatics are absent in Tg(fli1:EGFP); Tg(lyve1b:dsRed2); flt4-/- hearts (l) at 19–23 wpf (fish size 25–30 mm) as compared to wt siblings (k). (m) Quantification of blood and lymphatic vessel phenotype in flt4 -/- hearts (nwt = 4, nflt4 -/-=5 *p<0.01). (n–p) Tg(fli1:EGFP); Tg(lyve1b:dsRed2); vegfc +/- hearts at 26 wpf (fish size 25–30 mm) display severely defective ventricular lymphatics. (p) Quantification of blood vessel coverage and lymphatic sprout length and number, in vegfc +/- hearts (nwt = 3, nvegfc+/-=5 *p<0.005). (q–t) 12 wpf (fish size 19–22 mm) Tg(βactin2:loxP-mTagBFP-STOP-loxP-vegfaa)pd262; Tg(cmlc2:CreER) fish in the background of Tg(fli1:EGFP);Tg(lyve1b:dsRed2). The increase in lymphatic, but not blood vessel coverage induced by Vegfaa-OE (r), is reversed in vegfc+/- heterozygous animals (s). (t) Quantification of blood and lymphatic vessel coverage in (q–s) (nVegfaa-VEH = 3, nVegfaa-OE = 3, nVegfaa-VEH-blood vessel coverage=3, nVegfaa-OE-lymphatic vessel coverage=10 nVegfaa-OE;vegfc +/- -lymphatic vessel coverage=4, *p<0.01, relative to vehicle treated sibling control, **p<0.001 relative to Vegfaa-OE). Scale bars are 200 µm. Error bars, mean ± S.E.M. All panels show anterior views. |
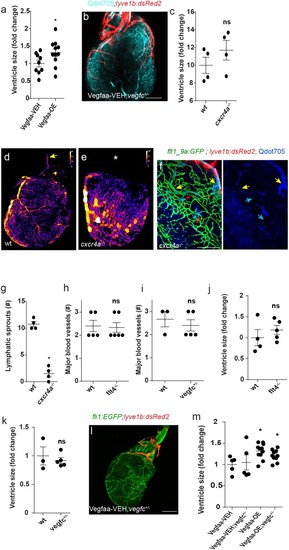
Ventricular size is increased following induction of Vegfaa-OE (nVegfaa-VEH = 9, nVegfaa-OE = 10, *p<0.01) ( |
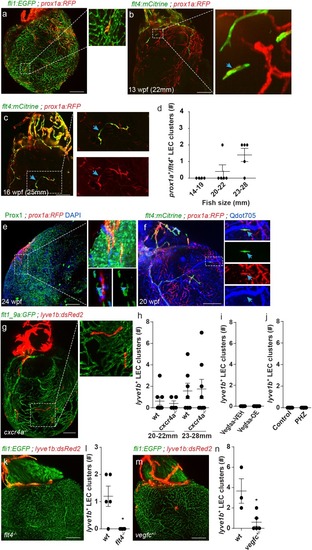
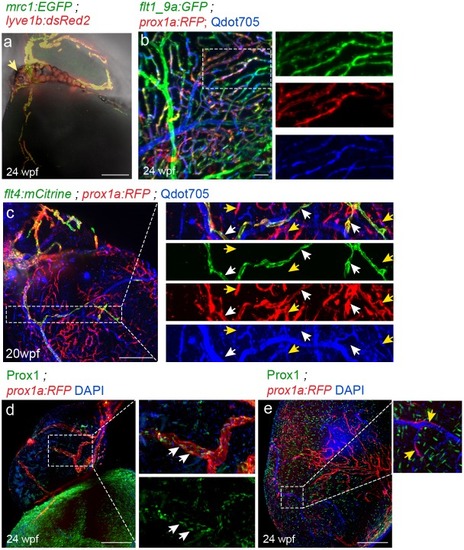
Insets are magnification of dashed boxes. (a) Tg(fli1:EGFP);Tg(prox1a:KalTA4-UAS:uncTagRFP) 16 wpf (fish size 23–28 mm) heart showing isolated lymphatic clusters (n = 8). (b,c) Double labeled prox1a+;flt4+ isolated LECs are first detected at ~13 wpf (20–22 mm) (b, arrows) and coalesce to generate isolated capillaries by 16wpf (fish size 25–28 mm) (c, arrows). (d) Quantification of double-labeled prox1a+;flt4+ isolated LECs in the ventricles of 14–28 mm fish (n14-19mm=4, n20-22mm=5, n23-28mm=5). (e) prox1a+ isolated LECs are also labeled by Prox1 antibody (inset, arrow). (f) 20 wpf (fish size 28 mm) double-transgenic prox1a;flt4 hearts demonstrate that isolated LECs are not labeled following intravascular injection of Qdot705 (inset, arrow) (image in f) is an additional view of Figure 2—figure supplement 1c). (g) Isolated LEC clusters develop normally in 22 wpf (fish size 25–30 mm) Tg(flt1_9a_cFos:GFP);Tg(lyve1b:dsRed2); cxcr4a-/- hearts, quantified in (h) (nwt20-22mm=8, ncxcr4a-/- 20-22mm = 6, nwt23-28mm=7, ncxcr4a-/-23-28mm = 8). (i,j) lyve1b+ isolated LEC clusters are not precociously detected in Vegfaa-OE hearts (12.5 wpf, fish size 19–22 mm), in (i) (nveh = 7, nTam = 8) or PHZ treatment (j) (ncontrol = 9, nPHZ = 9) (k). No isolated LECs are detected in 19-23wpf (fish size 23–28 mm) Tg(fli1:EGFP);Tg(lyve1b:dsRed2);flt4 -/- hearts, quantified in (l) (nwt = 5, nflt4-/-=6). (m) Significantly reduced numbers of isolated LECs are detected in Tg(fli1:EGFP);Tg(lyve1b:dsRed2);vegfc+/- animals at 26 wpf (fish size 25–28 mm), quantified in (n) (nwt = 3, nvegfc+/-=5). Scale bars are 200 µm. Error bars, mean ± s.e.m. Anterior view in a-c, e,f,k,m. Posterior view in g. PHENOTYPE:
|
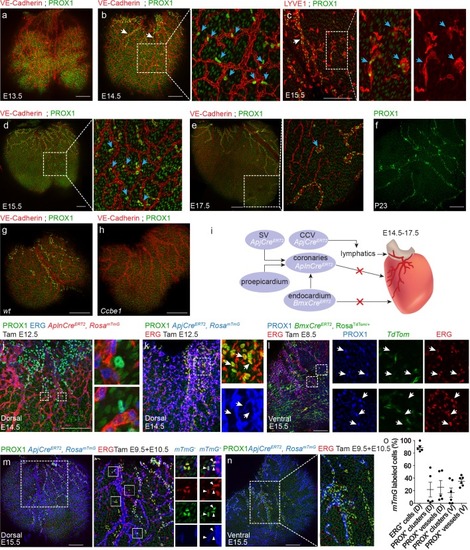
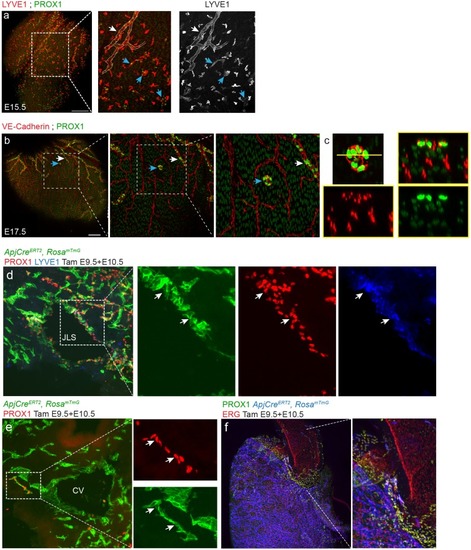
(a,b) Whole mount confocal images of mouse hearts immunonstained for VE-Cadherin and PROX1. (a) At E13.5 coronary (red) but not lymphatic vessels (green) are present on the ventricle surface (n = 6) (Low levels of PROX1 are detected in cardiomyocytes). (b) In addition to regular lymphatic vessels (white arrows), isolated PROX1+ LECs are observed in close proximity to the coronaries at E14.5 (inset, blue arrows) (n = 6). (c) Whole mount confocal images of E15.5 mouse hearts immunonstained for LYVE1 and PROX1. Isolated PROX1+/LYVE1+ LECs (blue arrows) are not connected to the main lymphatic sprouts (white arrow). (d,e) Whole mount confocal images of mouse hearts immunonstained for VE-Cadherin and PROX1. Isolated LECs gradually expand to form multicellular lumenized structures (inset, arrows) (n = 4). (f) PROX1+ isolated LECs are no longer detected at P23 (n = 4). (g,h) Whole mount confocal images of E15.5 mouse hearts immunonstained for LYVE1 and PROX1. PROX1+ LECs are absent from Ccbe1 mutant hearts (h) (nwt = 3, nCcbe1 = 3). (i) Lineage-tracing strategies for identification of cardiac LEC origins. (j) Dorsal view of AplnCreERT2,RosamTmG heart from embryo dosed with tamoxifen at E12.5 and analyzed at E14.5, showing no AplnCreERT2;PROX1+ LECs. Cre recombination is labeled in red, ECs in blue (Erg) and lymphatics in green (PROX1). Insets are magnification of dashed boxes. (n = 7). (k) Dorsal view of ApjCreERT2,RosamTmG heart, showing that PROX1+ LECs are not labeled by ApjCreERT2 in embryos dosed with tamoxifen at E12.5 and analyzed at E14.5. Cre recombination is marked in blue, ECs in red (ERG) and lymphatics in green (PROX1). Insets are magnification of dashed boxes (n = 4). (l) Ventral view of heart from BmxCreERT2, RosaTdTom embryos dosed with tamoxifen at E8.5 and analyzed at E15.5, showing that PROX1+ LECs are not labeled by BmxCreER. Cre recombination is marked in green, ECs in red (ERG) and lymphatics in blue (PROX1). Inset is magnification of dashed boxes. (n = 5). Dorsal (m) and ventral (n) views of ApjCreERT2,RosamTmG embryos dosed with tamoxifen at E9.5 and 10.5 and analyzed at E15.5, showing PROX1+ isolated LECs and lymphatic vessels, labeled by ApjCreERT2. Cre recombination is marked in blue, ECs in red (ERG) and lymphatics in green (PROX1). (o) Quantification of mTmG labeling shows reduced ApjCreERT2 lineage traced PROX1+ cells as compared to ERG ECs (recombination efficiency). D;Dorsal, V;Ventral (nD = 5, nV = 6) Insets are magnification of dashed boxes. (nDorsal = 6, nVentral = 5). Scale bars are 200 µm. |
( |
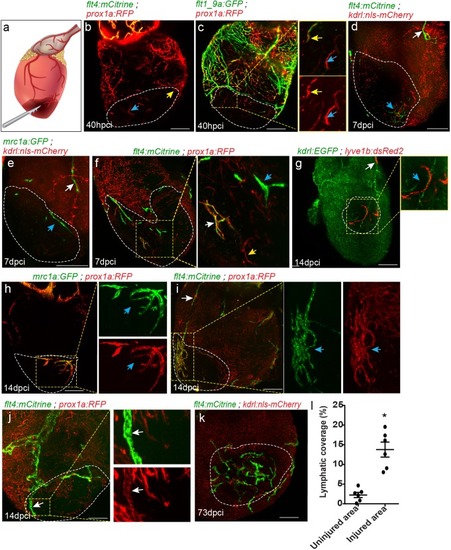
Differential response of cardiac lymphatics to injury. (a) Diagram depicting the cryoinjury procedure. Injured area is outlined in all images, insets show high-magnification of dashed boxes. (b) flt4;prox1a transgenic hearts at 40 hpci showing prox1a+ sprouts (yellow arrow) and isolated LECs (blue arrow) in the injured area (n = 5). (c) Tg(flt1_9a_cFos:GFP);Tg(prox1a:KalTA4-UAS:uncTagRFP) double labeled coronary sprouts (inset, yellow arrow), as well as prox1a+ isolated LECs (inset, blue arrow) are detected in the injured area at 40 hpci. (d–f) seven dpci injured hearts of (d) Tg(kdrl:nls-mCherry);Tg(flt4BAC:mCitrine) (n = 5), (e) Tg(kdrl:nls-mCherry);Tg(mrc1a:EGFP) (n = 5), and (f) Tg(prox1a:KalTA4-UAS:uncTagRFP);Tg(flt4BAC:mCitrine) (n = 5) fish, with white arrows pointing to OFT-connected ventricular lymphatics, and blue arrows pointing to isolated LECs in the injured area. (g–i) 14 dpci ventricles of (g) Tg(flt1_9a_cFos:GFP;Tg(lyve1b:dsRed2) (n = 8), (h) Tg(prox1a:KalTA4-UAS:uncTagRFP) (n = 5) and (i) Tg(prox1a:KalTA4-UAS:uncTagRFP);Tg(flt4BAC:mCitrine) (n = 5) showing isolated lymphatic sprouts in the injured area (blue arrows), which are not connected to ventricular lymphatics (white arrow) (j) Double labeled prox1a;flt4 ventricular lymphatic sprouts invade the injured area at 14 dpci (inset, white arrows) (n = 3). (k) 73 dpci Tg(kdrl:nls-mCherry);Tg(flt4BAC:mCitrine) heart showing increased lymphatic coverage in the injured vs. uninjured areas of the ventricle, quantified in (l). Error bars, mean ± s.e.m. *p<0.001. Scale bars are 200 µm. Fish size 25–30 mm. PHENOTYPE:
|
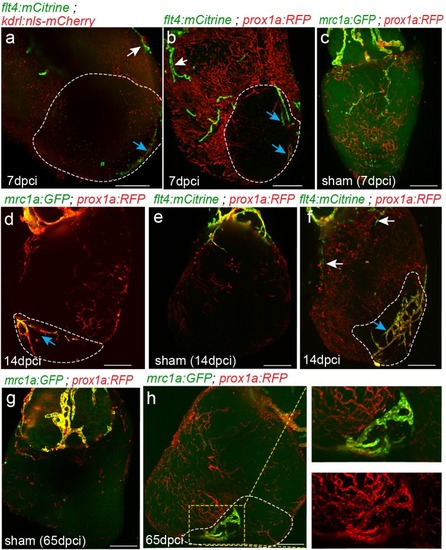
Injured area is outlined in all images. ( |
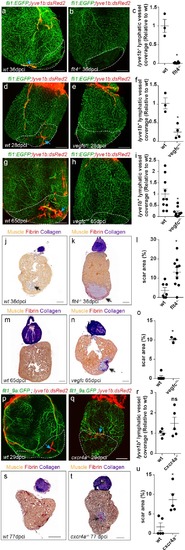
Injured area is outlined in all images (a,b) lyve1b+ lymphatic capillaries (blue arrows) are detected in the injured area of 36 dpci Tg(fli1:EGFP); Tg(lyve1b:dsRed2) wt sibling (a) but not in flt4-/- hearts (b). (c) Quantification of lyve1b+ lymphatic vessel coverage in the injured area of 35–38 dpi flt4-/- hearts (nwt = 3, nflt4-/-=8, *p<0.001). (d–i) lyve1b+ lymphatic capillaries (blue arrows) are detected in the injured area of 28 dpci (d) and 65 dpci (g) Tg(fli1:EGFP); Tg(lyve1b:dsRed2) wt siblings, but not in vegfc+/- heterozygous fish (e,h). (f,i) Quantification of lyve1b+ lymphatic vessel coverage in the injured area of 21–28 dpi vegfc+/- hearts (nwt = 3 hearts, nvegfc +/-=4, *p<0.005) and 65–66 dpi vegfc +/- hearts (nwt = 10 hearts, nvegfc+/-=10, *p<0.005). (j,k) AFOG-stained sections at 36 dpci showing lack of regeneration in flt4 -/- hearts (k) as compared to wt siblings (j). Collagenous scar is stained in blue, fibrin in red, and cardiac muscle in orange. Black arrow points to scar. (l) Increased scar area (calculated as percent of ventricle) in flt4-/- hearts (nwt = 8 hearts, nflt4-/-=11, *p<0.05). (m,n) AFOG-stained sections at 65 dpci showing lack of regeneration in vegfc+/- hearts (n) as compared to wt siblings (m). Black arrow points to scar. (o) Increased scar area (calculated as percent of ventricle) in vegfc+/- hearts (nwt = 6 hearts, nvegfc+/-=3, *p<0.001). (p,q) lyve1b+ isolated LEC clusters (blue arrows) are normally detected in the injured area of 29 dpci Tg(flt1_9a_cFos:GFP);Tg(lyve1b:dsRed);cxcr4a-/- (q) and wt sibling (p) hearts. (r) Quantification of lyve1b+ lymphatic vessel coverage (relative to wt sibling) in 29 dpi cxcr4a -/- hearts (nwt = 4 hearts, ncxcr4a-/-=5). (s,t) AFOG-stained sections at 77 dpci showing impaired regeneration in cxcr4a-/- mutant (t) as compared to wt siblings (s). Black arrow points to scar. (u) Increased scar area (calculated as percent of ventricle) in cxcr4a-/- mutant hearts (nwt = 5 hearts, ncxcr4a-/-=5, *p<0.005). Scale bars are 200 µm. All fish size are 25–30 mm. PHENOTYPE:
|