
- Title
-
New insights into organ-specific oxidative stress mechanisms using a novel biosensor zebrafish
- Authors
- Mourabit, S., Fitzgerald, J.A., Ellis, R.P., Takesono, A., Porteus, C.S., Trznadel, M., Metz, J., Winter, M.J., Kudoh, T., Tyler, C.R.
- Source
- Full text @ Environ. Int.

Chemical-dependent tissue-specific responses in the zebrafish transgenic EpRE line Tg (3EpRE:hsp70:mCherry). (A) Simplified overview of the Keap1-Nrf2 pathway and activation of the 3EpRE:hsp70:mCherry transgene. (B): Compounds tested and their target tissues are represented by the coloured circles on a 4 day old zebrafish larva. Enlarged circles display a, ionocytes; b, hepatocytes; c, pronephric proximal tubules; d, neuromasts; e, erythrocytes. |

Concentration-dependent tissue fluorescence in Tg (3EpRE:hsp70:mCherry) zebrafish larvae exposed to diethylmaleate (DEM). Fish larvae were exposed to solvent control (A) and three concentrations of DEM (B; C; D) from 2 to 4 dpf, and subsequently imaged via epifluorescence and confocal microscopy. A confocal image of the frontal head region (E) is presented to illustrate the range of surface tissues (e.g. skin cells, neuromasts, olfactory pits) affected by exposure to 35.9 μM DEM. For images (A–D), fluorescence intensity is represented using a “Fire” lookup table with a 0–255 pixel intensity calibration bar. Measured DEM E3 culture medium concentrations displayed. |

Concentration-dependent tissue responses in Tg (3EpRE:hsp70:mCherry) zebrafish larvae exposed to acetaminophen (APAP). Fish larvae were exposed to a solvent control (Ai, ii) and three concentrations of APAP (B; C; Di, ii) from 2 to 4 dpf and subsequently imaged via epifluorescence and confocal microscopy. Confocal images illustrate a pronephric convoluted tubule and the liver under control (Aii) and 4.5 mM APAP (Dii) conditions. Arrowheads = pronephric convoluted tubule; arrows = liver; asterisk = retina. For images A–D, fluorescence intensity is represented using a “Fire” lookup table with a 0–255 pixel intensity calibration bar. Measured APAP culture medium concentrations displayed. |

Concentration-dependent tissue responses in Tg (3EpRE:hsp70:mCherry) zebrafish larvae exposed to cisplatin. Fish larvae were exposed to solvent control (Ai-v) and three concentrations of cisplatin (Bi-v; Ci-v; Di-v) from 2 to 4 dpf and subsequently imaged via epifluorescence and confocal microscopy. Confocal images of a lateral line neuromast labelled with SYTO24 and EpRE-mCherry expression and their colocalization, under control (Aii-v) and cisplatin exposed conditions (Bii-iv, Cii-iv, Dii-iv). Confocal images of a pronephric convoluted tubule under control (Av) and 100 μM cisplatin (Dv) Arrowheads = neuromast; arrow = pronephric convoluted tubule. For images A–D, fluorescence intensity is represented using a “Fire” lookup table with a 0–255 pixel intensity calibration bar. Nominal cisplatin culture medium concentrations displayed. |

Concentration-dependent tissue response in Tg (3EpRE:hsp70:mCherry) - zebrafish larvae exposed to phenylhydrazine (PhZ). Larvae were exposed to a solvent control (Ai-iv) and three concentrations of PhZ (B; C; Di-iv) from 2 to 4 dpf and subsequently imaged via epifluorescence and confocal microscopy. Confocal images of a section of the caudal artery under control (Aii-iv) and 0.05 μg/mL PhZ (Dii-iv) conditions. Arrowheads = responsive erythrocytes; asterisk = non-responsive erythrocytes. For images (A–D), fluorescence intensity is represented using a “Fire” lookup table with a 0–255 pixel intensity calibration bar. Nominal PhZ culture medium concentrations displayed. |
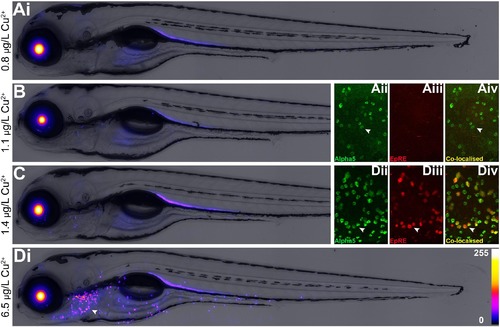
Concentration-dependent tissue response in Tg (3EpRE:hsp70:mCherry) - zebrafish larvae exposed to Cu2+. Fish larvae were exposed to either a control (0.83 μg/L Cu2+; Ai-iv) or three concentrations of Cu2+ (B; C; Di-iv) from 2 to 4 dpf and subsequently imaged via epifluorescence and confocal microscopy. Confocal microscopic images of fixed larvae under control (Aii-iv) and 6.46 μg/L Cu2+ (Dii-iv) conditions; green fluorescence indicates staining with an anti-Na+ K+ ATPase antibody (alpha5), red fluorescence is EpRE-mCherry signal, and yellow indicates co-localised signal. Arrowheads = ionocytes. For images (A–D), fluorescence intensity is represented using a “Fire” lookup table with a 0–255 pixel intensity calibration bar. Measured Cu2+ culture medium concentrations displayed. (For interpretation of the references to color in this figure legend, the reader is referred to the web version of this article.) |