
- Title
-
Brain-specific homeobox Bsx specifies identity of pineal gland between serially homologous photoreceptive organs in zebrafish
- Authors
- Mano, H., Asaoka, Y., Kojima, D., Fukada, Y.
- Source
- Full text @ Commun Biol
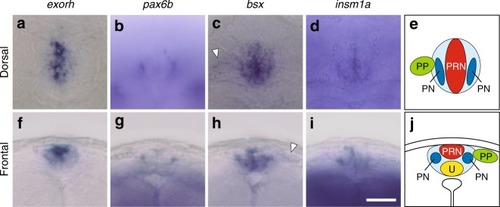
Expression patterns of EXPRESSION / LABELING:
|
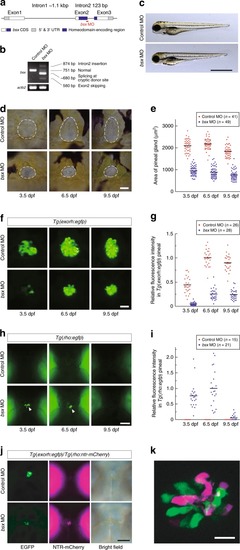
MO-mediated knockdown of EXPRESSION / LABELING:
PHENOTYPE:
|
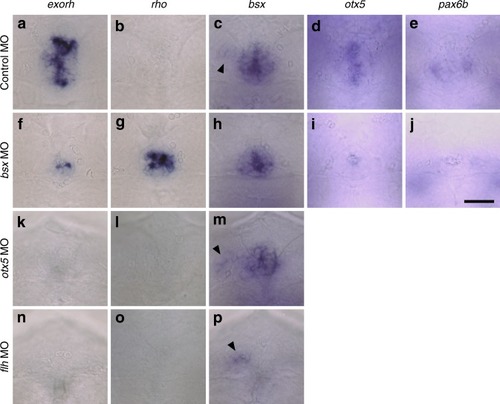
Effects of depletion of Bsx, Otx5 or Flh on the pineal gene expression at 48 hpf. |
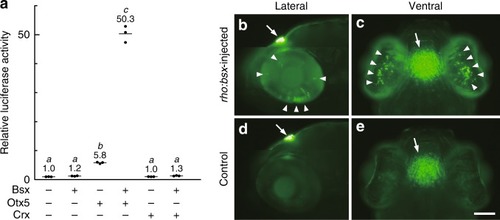
Bsx transactivates |

Bsx directly binds to |
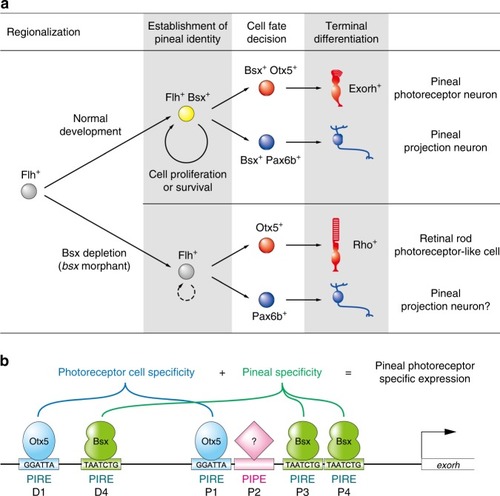
Models for specification mechanisms of the zebrafish pineal gland. |

ZFIN is incorporating published figure images and captions as part of an ongoing project. Figures from some publications have not yet been curated, or are not available for display because of copyright restrictions. |
|
ZFIN is incorporating published figure images and captions as part of an ongoing project. Figures from some publications have not yet been curated, or are not available for display because of copyright restrictions. |
|
ZFIN is incorporating published figure images and captions as part of an ongoing project. Figures from some publications have not yet been curated, or are not available for display because of copyright restrictions. EXPRESSION / LABELING:
PHENOTYPE:
|
|
ZFIN is incorporating published figure images and captions as part of an ongoing project. Figures from some publications have not yet been curated, or are not available for display because of copyright restrictions. EXPRESSION / LABELING:
PHENOTYPE:
|
|
ZFIN is incorporating published figure images and captions as part of an ongoing project. Figures from some publications have not yet been curated, or are not available for display because of copyright restrictions. |