
- Title
-
Restriction of mitochondrial calcium overload by mcu inactivation renders neuroprotective effect in Zebrafish models of Parkinson's disease
- Authors
- Soman, S.K., Bazała, M., Keatinge, M., Bandmann, O., Kuznicki, J.
- Source
- Full text @ Biol. Open
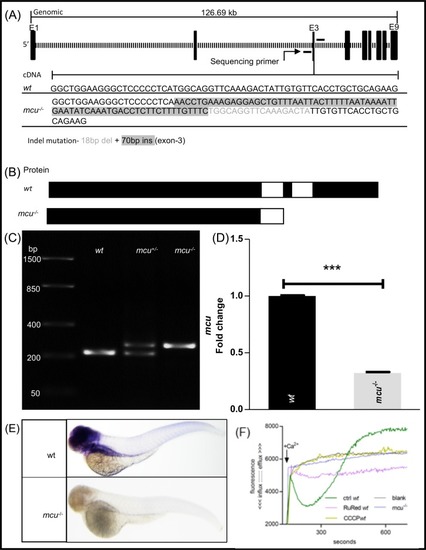
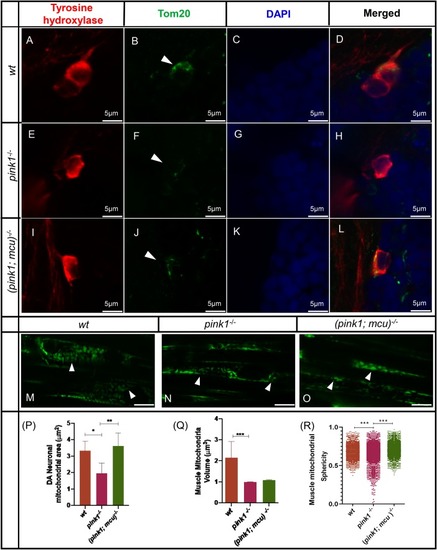
EXPRESSION / LABELING:
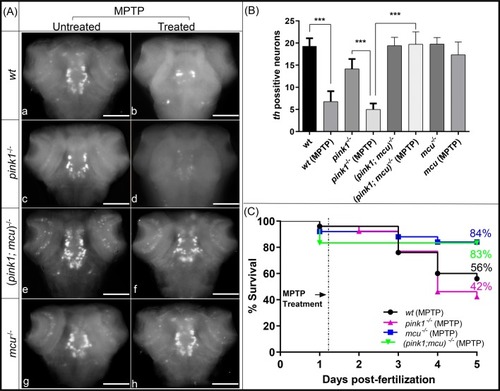
PHENOTYPE:
|
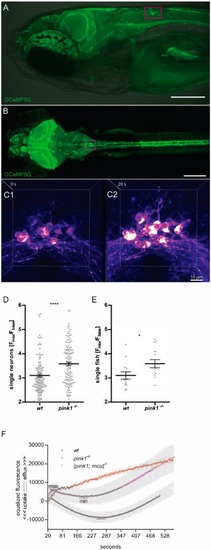
EXPRESSION / LABELING:
PHENOTYPE:
|
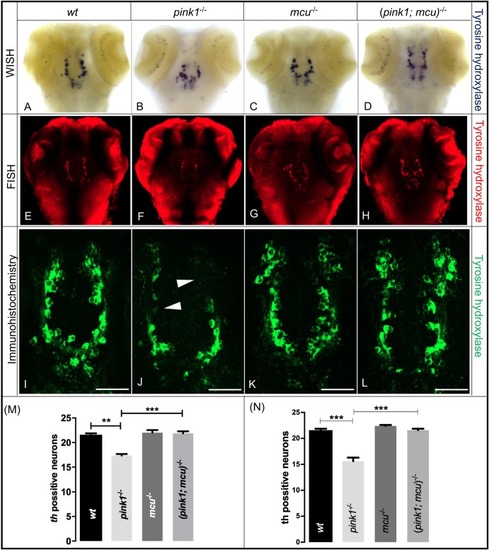
EXPRESSION / LABELING:
PHENOTYPE:
|
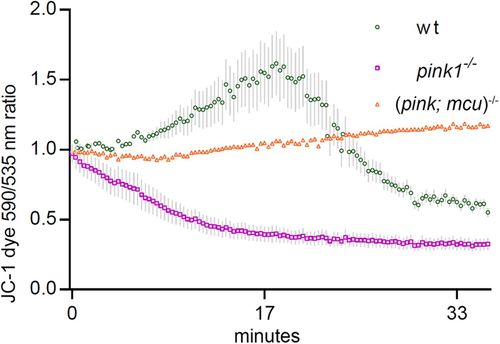
Mitochondrial membrane potential partly restored after mcu deletion. The graph represents ratio of JC-1 dye emission spectrum (590 nm to 530 nm). wt mitochondria showed a slight uptake of JC-1, which turned into leakage after ∼18 min after the start of the experiment, when mitochondria began to lose membrane integrity in an in vitro environment. PHENOTYPE:
|
EXPRESSION / LABELING:
PHENOTYPE:
|
EXPRESSION / LABELING:
PHENOTYPE:
|