
- Title
-
Cell-autonomous regulation of epithelial cell quiescence by calcium channel Trpv6
- Authors
- Xin, Y., Malick, A., Hu, M., Liu, C., Batah, H., Xu, H., Duan, C.
- Source
- Full text @ Elife

ZFIN is incorporating published figure images and captions as part of an ongoing project. Figures from some publications have not yet been curated, or are not available for display because of copyright restrictions. |
|
ZFIN is incorporating published figure images and captions as part of an ongoing project. Figures from some publications have not yet been curated, or are not available for display because of copyright restrictions. |
|
ZFIN is incorporating published figure images and captions as part of an ongoing project. Figures from some publications have not yet been curated, or are not available for display because of copyright restrictions. PHENOTYPE:
|
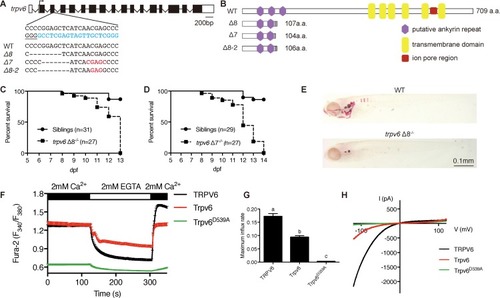
( PHENOTYPE:
|

( |
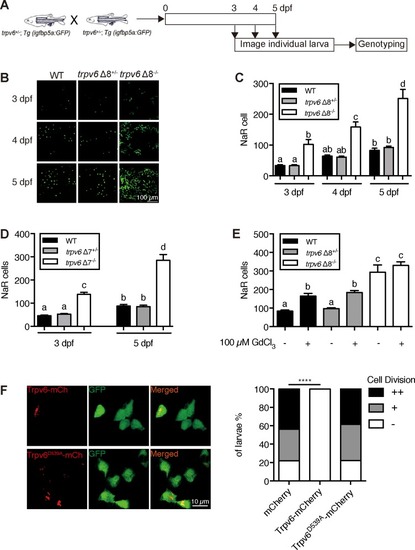
( EXPRESSION / LABELING:
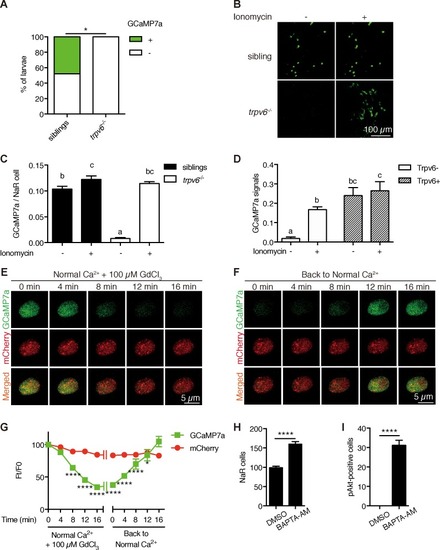
PHENOTYPE:
|

( |

( PHENOTYPE:
|

( |

( |

( |
Filled boxes indicate EXPRESSION / LABELING:
PHENOTYPE:
|
( |
( |
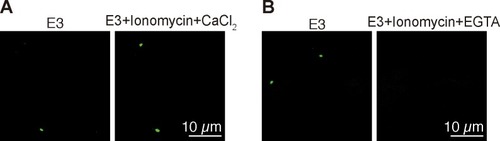
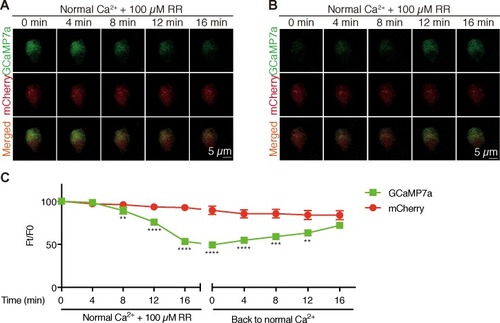
Time-lapse images of 3 dpf |
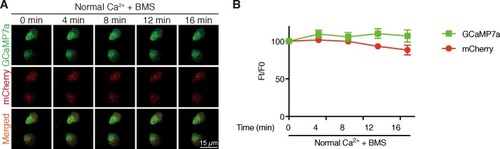
Time-lapse images of 3 dpf |