FIGURE SUMMARY
Title

A rare mutation in SMAD9 associated with high bone mass identifies the SMAD-dependent BMP signalling pathway as a potential anabolic target for osteoporosis

Authors
Gregson, C.L., Bergen, D., Leo, P., Sessions, R.B., Wheeler, L., Hartley, A., Youlten, S., Croucher, P.I., McInerney-Leo, A.M., Fraser, W., Tang, J.C.Y., Anderson, L., Marshall, M., Sergot, L., Paternoster, L., Davey-Smith, G., AOGC Consortium, Brown, M.A., Hammond, C., Kemp, J.P., Tobias, J.H., Duncan, E.L.
Source
Full text @ J. Bone Miner. Res.

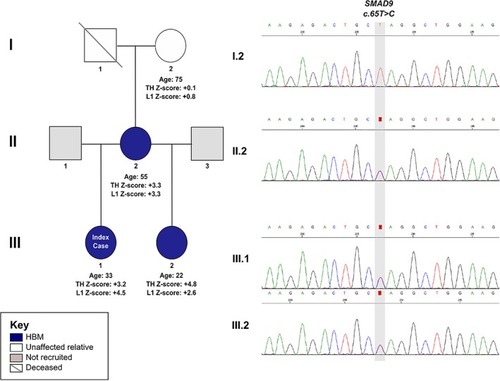
The HBM pedigree and electrophoretogram images of a segregating SMAD9 c.65T>C, p.Leu22Pro variant.

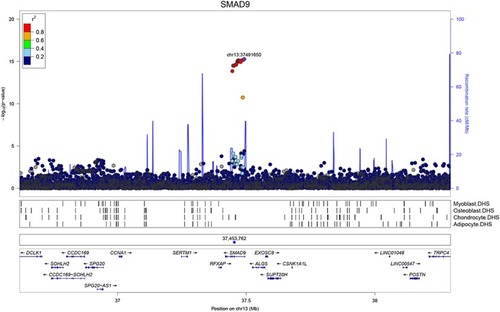
GWAS for eBMD measured in UK Biobank: Regional association plot for the locus containing SMAD9. Top panel: circles show unconditioned GWAS p values and genomic locations of imputed SNPs within ±800 kb of the 5′ and 3′ UTR of each gene. Colors indicate varying degrees of pairwise linkage disequilibrium between the lead eBMD‐associated SNP (rs12427846, purple diamond) and all other SNPs. Second panel: Vertical shaded areas correspond to locations of DNase I hypersensitive sites (DHSs) characteristic of skeletal muscle myoblasts cell line (E120), osteoblast primary cells (E129), mesenchymal stem cell–derived chondrocyte cultured cells (E049) and mesenchymal stem cell–derived adipocyte cultured cells (E023). Red shading depicts intersections between DHSs and genomewide significant SNPs. Black shading denotes instances in which any other SNPs intersect DHSs. Third panel: Blue circle shows the position of the putative causal variant c.65T>C, p.Leu22Pro. Fourth panel: Horizontal lines represent genes with vertical lines annotating location of exons. Arrows indicate the direction in which each gene is transcribed.

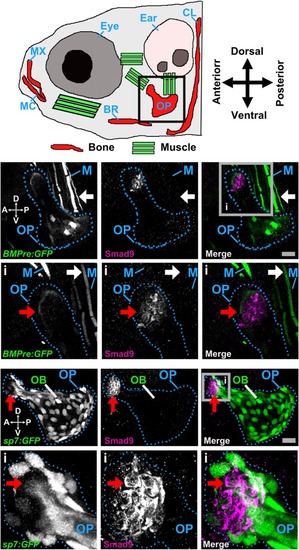
Smad9 protein expression in the larval zebrafish opercle bone. (A) Schematic of the larval zebrafish head (6 days post fertilization [dpf], lateral view), showing visible ossified elements (red) and the main muscle groups (green) that are green fluorescent protein (GFP)‐positive under control of the BMP‐responsive elements promoter (BMPre) transgenic reporter line (BMPre:GFP). The black box indicates the location of the intramembranous opercle bone as shown in B and C. (B) Distinct tissue distribution of Smad9‐ and BMP‐expressing cells (7 dpf). Upper left panel: BMPre:GFP‐positive cells (white) in the levator operculi muscle group (white arrow) and ventral (V) side of the opercle (OP; dotted blue outline); upper middle: distinct group of Smad9‐positive cells (white) in the dorsal (D) tip of the opercle; upper right: merged view showing distinct tissue expression of BMPre:GFP‐positive cells (green) and Smad9‐positive cells (purple); lower left: gray box inset (i) showing faint cap of BMPre:GFP‐positive cells at the dorsal tip of the opercle (red arrow); lower middle: cluster of Smad9‐positive cells; lower right: merged view confirming non‐overlapping distribution of BMPre:GFP‐positive cells and Smad9‐positive cells. Images from n = 4 larvae. (C) Distinct tissue distribution of Smad9‐ and osterix (Sp7)‐expressing cells (6 dpf). Upper left: Sp7:GFP‐positive osteoblasts (OB; white) within the opercle; upper middle: Smad9‐positive cells (white) in the antero (A)‐dorsal tip of the opercle (red arrow); upper right: merged view showing separation of Sp7:GFP‐positive cells (green) and Smad9‐positive cells (purple) (Supplemental Movie S1 in File S1); lower left: the inset (i, gray box) shows few Sp7:GFP‐positive osteoblasts within the dorsal tip of the opercle; lower middle: cluster of Smad9‐positive cells; lower right: merged view confirming non‐overlapping distribution of Sp7:GFP‐ and Smad9‐positive cells. Images from n = 6 larvae. (B, C) Scale bar = 20 μm; all are maximum‐intensity z‐projection confocal images. A = anterior; BR = branchiostegal ray; CL = cleithrum; D = dorsal; M = muscle; MC = Meckel's cartilage; MX = maxilla; OB = osteoblast; OP = operculum; P = posterior; V = ventral.

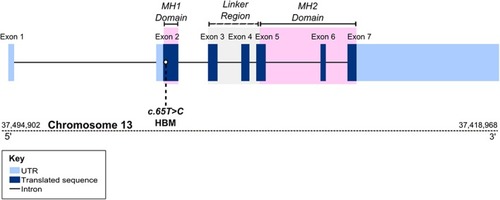
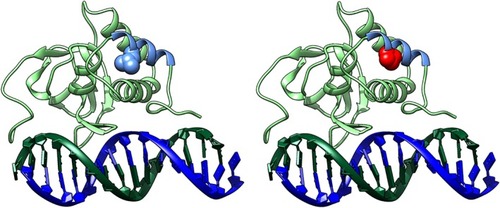
Position of c.65T>C p.Leu22Pro variant within SMAD9.

(A) Wild‐type (WT) SMAD9 MH1 domain (light green ribbon with helix‐1 in light blue) binding the DNA helix (dark blue/dark green). L22 is shown in blue space filling. (B) L22P, shown in red space filling, is predicted to severely disrupt the structure of the MH1 domain. Supplemental Movie S2 in File S1: 3‐dimensional rotating image.

ZFIN is incorporating published figure images and captions as part of an ongoing project. Figures from some publications have not yet been curated, or are not available for display because of copyright restrictions.

Acknowledgments
This image is the copyrighted work of the attributed author or publisher, and ZFIN has permission only to display this image to its users. Additional permissions should be obtained from the applicable author or publisher of the image. Full text @ J. Bone Miner. Res.