
- Title
-
Retrograde Ret signaling controls sensory pioneer axon outgrowth
- Authors
- Tuttle, A., Drerup, C.M., Marra, M., McGraw, H., Nechiporuk, A.V.
- Source
- Full text @ Elife
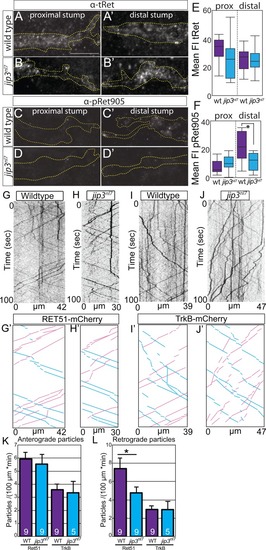
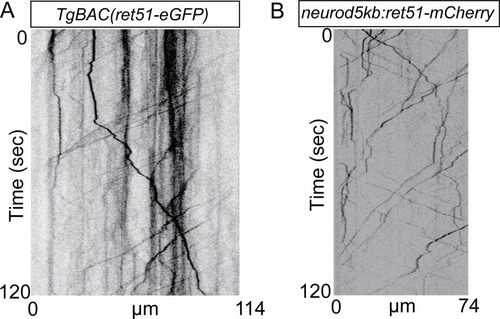
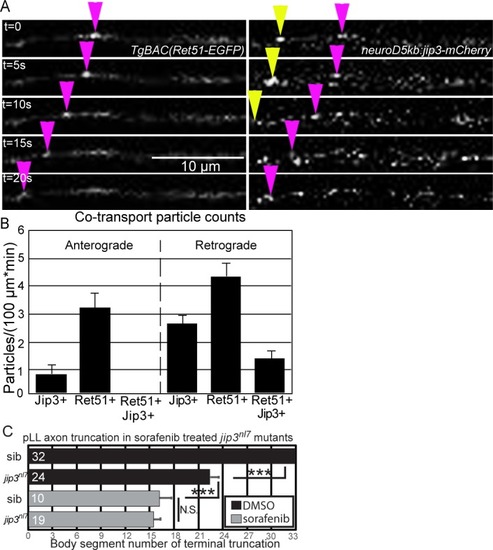
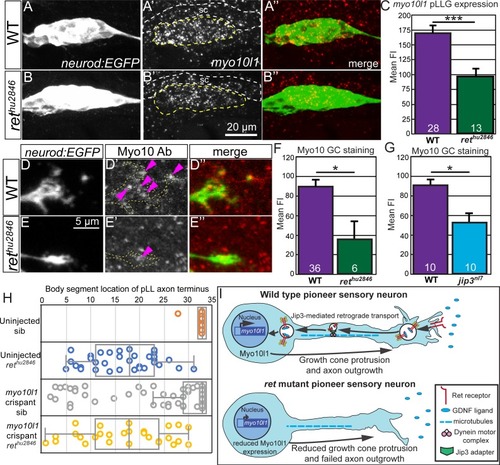
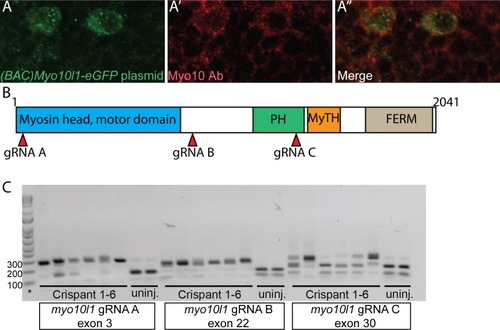
( EXPRESSION / LABELING:
PHENOTYPE:
|

( |

ZFIN is incorporating published figure images and captions as part of an ongoing project. Figures from some publications have not yet been curated, or are not available for display because of copyright restrictions. |

( These data can be opened with Microsoft Excel or with open-source alternatives such as OpenOffice. |
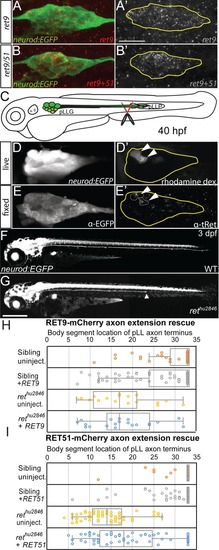
Whisker plot of body segment location of axon termination at 72 hpf. Siblings (n = 43) display no truncation compared to significant truncation in |
( |
( EXPRESSION / LABELING:
|
( |
( |
Treatment with 5 μM sorafenib from 24 to 72 hpf induced axon truncations in wild-type siblings (0.50 ± 0.06; n = 44) not significantly different than untreated PHENOTYPE:
|
|
ZFIN is incorporating published figure images and captions as part of an ongoing project. Figures from some publications have not yet been curated, or are not available for display because of copyright restrictions. PHENOTYPE:
|
( |
( |