FIGURE SUMMARY
Title

Suppression of transcytosis regulates zebrafish blood-brain barrier function

Authors
O'Brown, N.M., Megason, S.G., Gu, C.
Source
Full text @ Elife

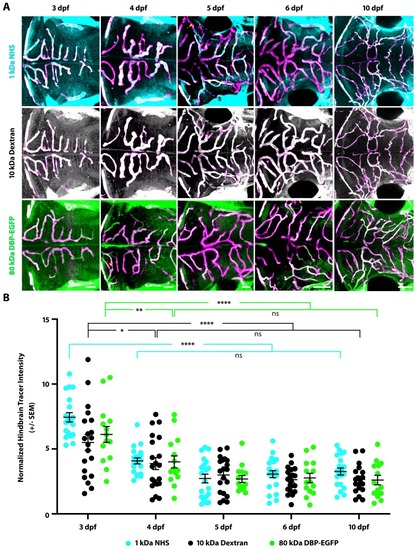
(A) Diagram of the tracer leakage assay. Fluorescently conjugated tracers (turquoise) were injected intracardially into transgenic fish that express mCherry in the vasculature (magenta; Tg(kdrl:mCherry)) and allowed to circulate for 1 hr before imaging. (B) Dorsal view maximum intensity projection of the larval brain vasculature at 3 dpf. Left image is pseudo-colored to demarcate the midbrain (violet) and the hindbrain (gold) vasculature. Right image shows the NHS tracer (turquoise) in the entire larval brain, with a large number of tracer-filled parenchymal cells in the midbrain. (C) Representative dorsal view maximum intensity projections of larval zebrafish midbrains at different developmental stages reveal increased permeability at 3 and 4 dpf compared to 5, 6 and 10 dpf. The increased early permeability was observed with two injected tracers of different sizes, a 1 kDa NHS (turquoise) and a 10 kDa Dextran (white), as well with an 80 kDa transgenic serum protein DBP-EGFP (green). Parenchymal tracer intensity outside of the vasculature (magenta) was measured and normalized to the blood vessel tracer intensity in each fish. Scale bars represent 50 µm. (D) Quantification of normalized parenchymal tracer intensity in the midbrain between 3 and 10 dpf reveals a significant decrease in tracer leakage at five dpf. There was no difference observed between different tracers at any time point. There was no significant change from 3 to 4 dpf or from 5 to 10 dpf, suggesting that the midbrain barrier seals around 5 dpf. N = 14–21 fish, each represented as a single dot on the plot. The mean and the standard error are drawn in black for each tracer and stage. ****p<0.0001, ns is not significant by two-way ANOVA.

The hindbrain BBB becomes functional at 4 dpf.

(A) Representative dorsal view maximum intensity projections of larval zebrafish hindbrains at different developmental stages reveals tracer permeability into the hindbrain parenchyma at 3 dpf that decreases at 4 dpf and remains low until 10 dpf. This low permeability was observed with two injected tracers of different sizes, a 1 kDa NHS (turquoise) and a 10 kDa Dextran (white), as well with an 80 kDa transgenic serum protein DBP-EGFP (green). Parenchymal tracer intensity outside of the vasculature (magenta) was measured and normalized to the blood vessel tracer intensity in each fish. Scale bars represent 50 µm. (B) Quantification of normalized parenchymal tracer intensity in the hindbrain between 3 and 10 dpf reveals a decrease in tracer uptake beginning at 4 dpf. There was no significant change from 4 to 10 dpf, suggesting that the hindbrain barrier seals around 4 dpf. N = 14–21 fish, each represented as a single dot on the plot. The mean and the standard error are drawn in black for each tracer and stage. ****p<0.0001, **p=0.0034, *p=0.0115, ns is not significant by two-way ANOVA.

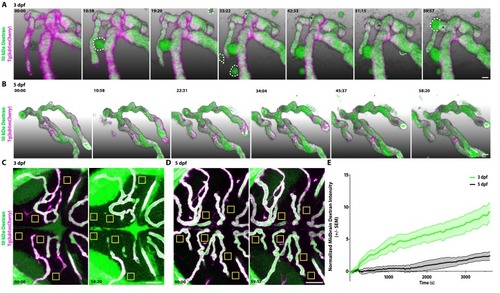
(A) Time course stills from Figure 2—Video 1 of tracer leakage at 3 dpf reveal an increase in parenchymal cells absorbing the Dextran tracer (outlined by dashed white lines) as well as a general increase in overall Dextran (green) intensity outside of the vasculature (magenta). An angiogenic tip cell becomes apparent at 33:23 and is demarcated by an asterisk (*). This tip cell produces two separate bursts of leakage observed in Figure 2—Video 2. (B) Time course stills from Figure 2—Video 3 of Dextran tracer dynamics at 5 dpf reveals a mature BBB, with reduced overall Dextran extravasation into the brain parenchyma. The scale bars represent 10 µm. (C and D) Dorsal maximum intensity projection of the midbrain at 3 dpf (C) and 5 dpf (D) at the first and last time point examined. While there is a large increase in overall parenchymal Dextran intensity over time at 3 dpf, the 5 dpf midbrain parenchyma appears relatively unaltered after an hour of Dextran circulation. Boxed regions are representative of the six areas per fish used for analysis in E. The scale bars represent 50 µm. (E) Quantification of Dextran intensity in the brain parenchyma over time at 3 dpf (green) and 5 dpf (black) shows a significant difference in tracer leakage dynamics (p<0.0001, Mann Whitney U test), with both more total Dextran accumulation and a faster rate of Dextran accumulation in the brain parenchyma at 3 dpf. N = 6 fish with 6 regions analyzed per fish.

Injected tracers are taken up by parenchymal cells.

(A) Maximum intensity projections (3 µm thick) of the midbrain of membrane labeled (turquoise; Tg(actb2:MA-Citrine) transgenic 3 dpf fish after 10 kDa Dextran injection (green) reveals several parenchymal cells outside of the vasculature (magenta) that contain Dextran within the cell membrane (outlined in white). (B) Maximum intensity projections (5 µm thick) of the midbrain of nuclear labeled (magenta; Tg(actb2:Has.H2B-Scarlet) transgenic fish after 10 kDa Dextran injection (green) reveals several parenchymal cells that are double labeled with Dextran and nuclear signal (outlined in white), further indicating that injected tracers are taken up by select parenchymal cells. Scale bars represent 50 µm.

Suppression of transcytosis determines the timing of functional BBB formation.

(A, C, E) TEM images of individual blood vessel cross-sections after injection of electron-dense gold nanoparticles at 3 dpf (A), 5 dpf (C), and 7 dpf (E). Endothelial cells (EC) are pseudo-colored green, pericytes (P) are pseudo-colored purple and red blood cells (RBC) are pseudo-colored red when present in the lumen (L). Turquoise arrowheads highlight the gold-filled basement membrane at 3 dpf (A). (B, D, F) High magnification images (25000x) of the areas boxed in A, C, and E, respectively, with the endothelial cells outlined with white dashed lines. The images are oriented with the lumen (L) on top and the ablumen (A) on the bottom. Tight junctions are functional as early as 3 dpf (B), as seen by their ability to halt the gold nanoparticles at the so-called ‘kissing point’ (green arrowhead), and remain functional throughout development (D and F). Even though the tight junctions are functional at 3 dpf, the endothelial basement membrane is filled with electron-dense gold nanoparticles (B, turquoise arrowheads). This appears to be due to an elevated level of luminal and abluminal gold-filled vesicles (magenta arrows). The scale bars represent 200 nm. (G) Quantification of the endothelial basement membrane gold intensity normalized to luminal gold intensity. (H and I) Quantification of the vesicular densities both on the luminal (H) and abluminal (I) membrane of endothelial cells reveals a suppression of vesicular densities beginning at 5 dpf that remains constant at 7 dpf. N = 4 fish, each marked with a different color, with at least 10 blood vessels quantified for each fish and displayed as single points. ****p<0.0001, **p<0.01, ns is not significant by nested one-way ANOVA.

10.7554/eLife.47326.012

Quantification of basement membrane gold intensity and vesicular densities during development.

(A) FISH for mfsd2aa (left), mfsd2ab (middle) and mouse Gfap negative control (right) in Tg(kdrl:mCherry) 3 dpf, 5 dpf and adult brain tissue. FISH for mfsd2aa (left) reveals no vascular expression above background at 3 dpf, high levels at 5 dpf and low levels in adult blood vessels. FISH for mfsd2ab (middle) reveals high levels of vascular signal at 3 and 5 dpf and negligible vascular signal in adults. Neither Mfsd2a paralogue was expressed exclusively in the vasculature, outlined in white, at any time examined and mfsd2ab displayed higher overall expression throughout the larval brain than mfsd2aa. Scale bar represents 10 µm. (B) Quantification of the number of transcript puncta per blood vessel area in 3 dpf, 5 dpf and adult brain sections after background (mouse Gfap expression) subtraction. N = 6 sections from at least 3 different fish.

EXPRESSION / LABELING:
Genes:
Fish:
Anatomical Terms:
Stage Range: Protruding-mouth to Adult

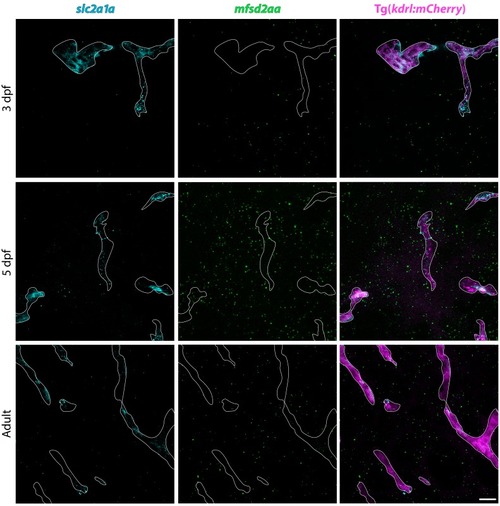
FISH for slc2a1a (turquoise) and mfsd2aa (green) in Tg(kdrl:mCherry) 3 dpf, 5 dpf and adult brain tissue. FISH for slc2a1a (turquoise) reveals distinct vascular signal at all time points examined, whereas mfsd2aa (green) vascular signal appears at 5 dpf and is maintained at low levels in adults. Scale bar represents 10 µm.

EXPRESSION / LABELING:
Gene:
Fish:
Anatomical Term:
Stage Range: Protruding-mouth to Adult

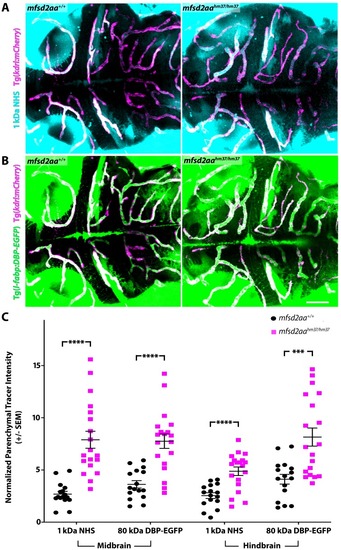
(A) Representative maximum intensity projection images of the brain of wild-type and mfsd2aa mutants injected with a fluorescent 1 kDa NHS tracer (turquoise) at 5 dpf. Mfsd2aa mutants have increased levels of NHS in the midbrain and hindbrain parenchyma outside of the vasculature (magenta; Tg(kdrl:mCherry)) compared to wild-type siblings. (B) Representative maximum intensity projection images of the brain of wild-type and mfsd2aa mutants expressing the fluorescently labeled 80 kDa transgenic serum protein DBP-EGFP (green) at 5 dpf. Mfsd2aa mutants have increased levels of DBP-EGFP in the midbrain and hindbrain parenchyma compared to wild-type siblings. The scale bar represents 50 µm. (C) Quantification of normalized parenchymal tracer intensity in the midbrain and hindbrain of wild-type (black) and mfsd2aa mutants (magenta) reveals that mfsd2aa mutants have significantly increased levels of tracer permeability, both for the injected NHS (A) and the endogenous transgene DBP-EGFP (B). Parenchymal tracer intensity outside of the vasculature was measured and normalized to the blood vessel tracer intensity for both the midbrain and hindbrain in each fish and displayed as a single point. The mean and the standard error are drawn as black lines. ****p<0.0001, ***p<0.001 by t test.

<italic>Mfsd2ab</italic> mutants do not have altered BBB permeability.

(A) Representative maximum intensity projection images of the brain of wild-type and mfsd2ab mutants expressing the fluorescently labeled 80 kDa transgenic serum protein DBP-EGFP (green) at 5 dpf. Mfsd2ab mutants have a similarly low level of DBP-EGFP in the midbrain and hindbrain parenchyma compared to wild-type siblings. The scale bar represents 50 µm. (B) Quantification of normalized parenchymal tracer intensity (NHS and DBP-EGFP) in the midbrain and hindbrain of wild-type (black) and mfsd2ab mutants (green). Mfsd2ab mutants display no significant barrier permeability defects, both for the injected NHS and the endogenous transgene DBP-EGFP (A). Each individual fish measured is displayed as a single point. The mean and the standard error are drawn in black.

Mosaic <italic>mfsd2aa</italic> crispants display increased BBB permeability while <italic>mfsd2ab</italic> crispants display a wild-type BBB.

(A) Representative maximum intensity projection images of the midbrain of 5 dpf uninjected controls, mfsd2aa and mfsd2ab crispant fish. Crispant fish were injected with Cas9 protein and two unique guide RNAs from those used to generate mutants to target either mfsd2aa or mfsd2ab. Mosaic mfsd2aa crispants display increased DBP-EGFP tracer permeability at similar levels to mfsd2aahm37/hm37 mutants (Figure 5) and displayed an 80% reduction in mfsd2aa levels by qPCR. Conversely, mfsd2ab crispants do not appear to have any BBB permeability defects, as observed in mfsd2abhm38/hm38 mutants (Figure 5), while displaying a 60% reduction in mfsd2ab levels by qPCR. The scale bar represents 50 µm. (B) Quantification of DBP-EGFP tracer intensity in the midbrain and hindbrain parenchyma of uninjected controls (black), mfsd2aa crispants (magenta) and mfsd2ab crispants (green). DBP-EGFP intensity was measured in the midbrain and averaged to generate a single value per fish that was normalized to circulating tracer levels. Each individual fish measured is displayed as a single point. The mean and the standard error are drawn in black. ****p<0.0001 by two-way ANOVA.

<italic>Mfsd2aa<sup>hm37/hm37</sup>; mfsd2ab<sup>hm38/hm38</sup></italic> double mutants display similar increased BBB permeability to <italic>mfsd2aa<sup>hm37/hm37</sup></italic> single mutants.

(A–D) Representative maximum intensity projection images of the midbrain of wild-type (A; mfsd2aa+/+; mfsd2ab+/+), mfsd2aahm37/hm37 single mutants (B), mfsd2abhm38/hm38 single mutants (C), and mfsd2aahm37/hm37; mfsd2abhm38/hm38 double mutants (D) expressing the fluorescently labeled 80 kDa transgenic serum protein DBP-EGFP (green) at 5 dpf. Mfsd2aahm37/hm37; mfsd2abhm38/hm38 double mutants display a similar level of increased parenchymal tracer permeability to the mfsd2aahm37/hm37 single mutants. The scale bar represents 50 µm. (E) Quantification of DBP-EGFP tracer intensity in the midbrain parenchyma of wild-type (black), mfsd2aahm37/hm37 mutants (magenta), mfsd2abhm38/hm38 mutants (green), and mfsd2aahm37/hm37; mfsd2abhm38/hm38 double mutants (turquoise). Each individual fish measured is displayed as a single point. The mean and the standard error are drawn in black. ****p<0.0001 by two-way ANOVA.

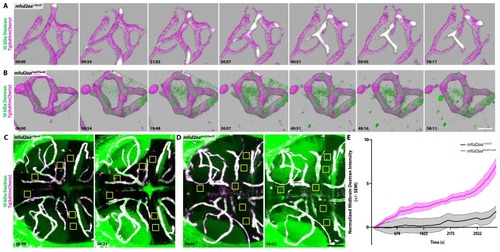
(A) Time course stills of Dextran tracer dynamics at 5 dpf in mfsd2aa heterozygote controls reveals a sealed BBB. (B) Time course stills of Dextran tracer dynamics in mfsd2aa mutants at 5 dpf reveals a leaky BBB, with increased overall Dextran extravasation into the brain parenchyma. The scale bar represents 20 µm. (C and D) Representative dorsal maximum intensity projection of the midbrain of mfsd2aa heterozygotes (C) and mfsd2aa mutants (D) at the first and last time point examined. While the heterozygotes restrict the Dextran within the cerebral blood vessels at 5 dpf, mfsd2aa mutants exhibit a large increase in overall parenchymal Dextran intensity over the course of 1 hr. Boxed regions are representative of the 6 areas per fish used for analysis in E. The scale bar represents 50 µm. (E) Quantification of Dextran intensity in the brain parenchyma over time in heterozygote controls (black) and mfsd2aa mutants (magenta) shows a significant difference in tracer leakage dynamics (p<0.0001, Mann Whitney U test), with both more total Dextran accumulation and a faster rate of Dextran accumulation in the mutant brain parenchyma than heterozygote controls. N = 9 fish with 6 regions analyzed and averaged per fish and normalized to Dextran intensity in circulation.

Adult <italic>mfsd2aa</italic> mutants display increased BBB permeability.

(A and B) Sagittal sections of the adult brain of wild-type (A) and mfsd2aa mutants (B) reveals increased extravasation of the transgenic DBP-EGFP serum fusion protein (green) in the forebrain (FB), midbrain (MB) and hindbrain (HB) of mfsd2aa mutants compared to wild-type siblings. The scale bar represents 100 µm. (C) Quantification of normalized parenchymal DBP-EGFP tracer intensity in the forebrain, midbrain and hindbrain of wild-type (black) and mfsd2aa mutants (magenta) reveals that mfsd2aa mutants have significantly increased levels of DBP-EGFP permeability throughout the adult brain. Parenchymal tracer intensity outside of the vasculature was measured in 6 distinct areas, averaged and normalized to the blood vessel DBP-EGFP intensity for each region (FB, MB and HB) and displayed as a single point for each fish. The mean and the standard error are drawn as black lines. ****p<0.0001 by t test.

10.7554/eLife.47326.029

Adult <italic>mfsd2aa</italic> mutants display increased BBB permeability.

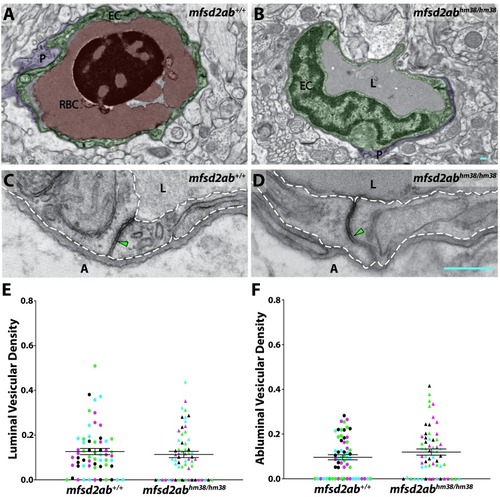
(A and B) TEM images of individual blood vessel cross-sections of adult wild-type (A) and mfsd2aa mutant fish (B). Endothelial cells (EC) are pseudo-colored green, pericytes (P) are pseudo-colored purple and red blood cells (RBC) are pseudo-colored red. (C and D) High-magnification images of endothelial cells outlined with white dashed lines of wild-type (C) and mfsd2aa mutants (D). The images are oriented with the lumen (L) on top and the ablumen (A) on the bottom. Mfsd2aa mutants appear to have normal tight junctions (green arrowhead) but elevated levels of luminal and abluminal vesicles (magenta arrows). The scale bars represent 200 nm. (E and F) Quantification of the vesicular densities both on the luminal (E) and abluminal (F) side of the endothelial cells reveals that mfsd2aa mutants have increased vesicular densities. N = 4 fish, each marked with a different color, with 15 blood vessels quantified for each fish and displayed as single points. ****p<0.0001, **p<0.01 by nested t test.

M<italic>fsd2ab</italic> mutants exhibit normal vascular maturation.

(A and B) TEM images of individual blood vessel cross-sections of adult wild-type (A) and mfsd2ab mutants (B). Endothelial cells (EC) are pseudo-colored green, pericytes (P) are pseudo-colored purple and red blood cells (RBC) are pseudo-colored red when present in the lumen (L). (C and D) High-magnification images of endothelial cells outlined with white dashed lines of wild-type (C) and mfsd2ab mutants (D). The images are oriented with the lumen (L) on top and the ablumen (A) on the bottom. Mfsd2ab mutants appear to have normal tight junctions (green arrowhead) and levels of luminal and abluminal vesicles. The scale bars represent 200 nm. (E and F) Quantification of the vesicular densities both on the luminal (E) and abluminal (F) side of the endothelial cells reveals that mfsd2ab mutants have similar vesicular densities to wild-type siblings. N = 4 fish, each marked with a different color, with 15 blood vessels quantified for each fish and displayed as single points.

Acknowledgments
This image is the copyrighted work of the attributed author or publisher, and ZFIN has permission only to display this image to its users. Additional permissions should be obtained from the applicable author or publisher of the image. Full text @ Elife