FIGURE SUMMARY
Title

Rag1 immunodeficiency-induced early aging and senescence in zebrafish are dependent on chronic inflammation and oxidative stress

Authors
Novoa, B., Pereiro, P., López-Muñoz, A., Varela, M., Forn-Cuní, G., Anchelin, M., Dios, S., Romero, A., Martinez-López, A., Medina-Gali, R.M., Collado, M., Coll, J., Estepa, A., Cayuela, M.L., Mulero, V., Figueras, A.
Source
Full text @ Aging Cell

Rag1−/− zebrafish present with altered survival and cellular features, potentially indicating severe DNA damage. (a) Kaplan–Meier representation of the survival of rag1−/− zebrafish and their wt siblings (n  =  72 rag1−/−, n =  128 wt). The log‐rank (Mantel–Cox) test was used for statistical analysis (p < 0.0001). (b) Cell cycle distribution of kidney cells based on the amount of DNA present. Cells were isolated from wt and rag1−/− fish, stained with propidium iodide, and examined by flow cytometry. Representative histograms from one wt and rag1−/− fish are shown. Apoptotic cells are clearly visible in the rag1−/− fish. (c) The percentage of cells in G0/G1, S, and G2/M was analyzed using ModFit LT 4.1 software. The stacked graphs represent the means ± SEM of the fish from the different groups. Significant differences in the percentage of G1 and G2/M cells were observed between wt and rag1−/− at the age of 1 year and 9 months (*p < 0.05). (d) Percentage of apoptotic cells in the kidneys of wt and rag1−/− fish, as determined by TUNEL assays. Positive cells were counted in 20 images. The means ± SEM are presented. (e) The dynamics of telomeres in rag1−/− zebrafish. Telomere length of 8‐ and 12‐month‐old zebrafish with the indicated genetic backgrounds, as assayed by FLOW‐FISH. The results are shown as the means ± SEM of four fish; p < 0.05 according to Student's t test. a.u.f, arbitrary units of fluorescence. (f) Immunocytochemical quantification of histone γ‐H2AX in kidney cells from wt and rag1−/− fish (aged 1 year and 9 months old). The number of positive cells was counted in 35 images. The means ± SEM are presented; p < 0.001 significantly different from wt fish. Confocal images of kidney cells reveal the location of histone γ‐H2AX foci in wt and rag1−/− fish. Nuclei are stained with DAPI and are shown as blue. Histone γ‐H2AX was observed using the Alexa Fluor 568 secondary antibody and is presented as pink. Scale bar = 25 µm. In all experiments, the results represent the means ± SEM of the percentage of positive cells. Mann–Whitney U tests were conducted to compare the means using GraphPad Prism 6 software (p < 0.001)

Rag1−/− zebrafish present with histological defects and alterations compared with wt siblings. (a–c) Premature aging signals in rag1−/− zebrafish. Representative images of retina (a) and liver (b, c) sections from 1‐year‐old wt and rag1−/− zebrafish (n = 5). (a) H&E‐stained eye sections revealed the loss of the photoreceptor layer and reduced thickness of nuclear layers. (b) The liver presents with hepatocyte cytoplasmic vacuolization. (c) Liver sections reveal numerous PAS‐positive areas, suggesting cytosolic accumulation of aging biomarker lipofuscin in hepatocytes (arrows). (d–i) Macrophage infiltration in rag1−/− zebrafish. Representative images of retina (d, g), skin (e, h), and muscle (f, i) sections from 1‐year‐old rag1−/− zebrafish. Consecutive anti‐Lcp‐ and anti‐Mpx‐immunostained sections reveal strong macrophage infiltration (Lcp+/Mpx) in the different tissues examined

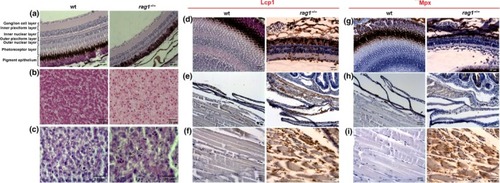
Senescence detection in rag1−/− zebrafish and reversion by senolytic and antioxidant treatments. (a–c) Expression of the senescence marker genes tp53, mdm2, and CIP/KIP (p21, p27, p57) and INK4 (cdkn2a/b, cdkn2c) inhibitors in the visceral organs of wt and rag1−/− zebrafish. (a) Comparison of the expression in wt and rag1−/− fish under naïve conditions. (b) Effect of the one‐month‐long treatment with ABT‐263 and ALCAR in wt and (c) rag1−/− zebrafish. The expression level of each gene was normalized to 18s gene expression and is expressed as the fold change with respect to the levels detected in the corresponding control group (a: wt; b: wt control; c: rag1−/− control). (d, e) SA‐β‐gal activity in the skin of one‐year‐old zebrafish. (d) Differences in the percentage of β‐gal‐positive pixels between wt and rag1−/− fish under naïve conditions. (e) Effect of the one‐month‐long treatment with ABT‐263 and ALCAR in wt and rag1−/− zebrafish. The graphs represent the means ± SEM of five independent biological replicates. Significant differences are displayed as **(0.001 < p < 0.01) or *(0.01 < p < 0.05)

Gene expression of typical SASP components in rag1−/− and wt zebrafish and effect of the senolytic drugs in the expression of immune genes differentially expressed between both zebrafish lines. (a) Comparison of the expression of potential SASP genes in wt and rag1−/− zebrafish at different ages. The expression level of each gene is normalized to the expression of the 18s gene. The graphs represent the means ± SEM of four independent biological replicates. Significant differences between wt and rag1−/− fish at each sampling point are displayed as *(0.01 < p < 0.05). (b) Il1b detection in liver sections from one‐year‐old wt and rag1−/− zebrafish. Arrows indicate Il1b‐positive dots. (c) Effect of the one‐month‐long treatment with ABT‐263 and ALCAR in the transcription of different genes differentially expressed between one‐year‐old rag1−/− and wt zebrafish. The expression level of each gene was normalized to 18s gene expression and is expressed as the fold change with respect to the levels detected in the untreated wt fish. The graphs represent the means ± SEM of five independent biological replicates. Significant differences between wt and rag1−/− fish at each sampling point are displayed as *(0.01 < p < 0.05)

ZFIN is incorporating published figure images and captions as part of an ongoing project. Figures from some publications have not yet been curated, or are not available for display because of copyright restrictions.

EXPRESSION / LABELING:
Genes:
Fish:
Anatomical Term:
Stage Range: Day 4 to Adult
PHENOTYPE:
Fish:
Observed In:
Stage Range: Day 4 to Adult

ZFIN is incorporating published figure images and captions as part of an ongoing project. Figures from some publications have not yet been curated, or are not available for display because of copyright restrictions.

Acknowledgments
This image is the copyrighted work of the attributed author or publisher, and ZFIN has permission only to display this image to its users. Additional permissions should be obtained from the applicable author or publisher of the image. Full text @ Aging Cell