
- Title
-
CoRest1 regulates neurogenesis in a stage-dependent manner
- Authors
- Monestime, C.M., Taibi, A., Gates, K.P., Jiang, K., Sirotkin, H.I.
- Source
- Full text @ Dev. Dyn.

Expression pattern of rcor1 in early zebrafish development. A‐C. At 4, 6, and 13 hpf rcor1 is ubiquitously expressed in the embryo. At 19 (D) and 36 hpf larvae have broad rcor1 expression throughout the head shown in both lateral and dorsal views at 36 hpf (E‐F). G‐J. Lateral and dorsal images of 48 and 57 hpf, respectively, show expression of rcor1 in the eye and posterior optic tectum. Transverse sections of 42 hpf larvae of the forebrain, midbrain, hindbrain, and anterior trunk (K‐N). Dorsal view of whole 42 hpf embryo used for transverse sectioning (O). Brackets outline the proliferative zone along the midline indicating regions of undifferentiated cell populations. Staining is seen in the eyes, OT, tg, and cg. hpf, hours postfertilization; OT, optic tectum; tg, tegmentum, cg, cranial ganglia (scale bar = 15 µm) |

Expression analysis of Rest target genes in MZrcor1 mutants. A. qPCR analysis of RE‐1 containing genes in MZrcor1 mutantscompared to related wild‐type control embyos at 4 hpf. Increased expression of snap25b is observed in MZrcor1mutants, but no significant differences in expression level is seen in snap25a, synt4, nfsa, npas4a, grm5, scn3, kcnh8, sty10, and bdnf, while decreased expression of gpr27 and amph is observed in MZrcor1 mutant embryos MZrcor1 mutant expression is set to 1 because some markers are not detectable (ND) in wild‐types. B‐E. RNA in situ hybridization at 24 hpf showing ectopic expression of snap25b in the hindbrain of MZrcor1 mutants (indicated by arrowheads) (seen in 6/10) (B,C) and comparable snap25a expression in MZrcor1 mutants and wild‐type controls (D,E). qPCR analysis of rcor2 and rcor3 expression in MZrcor1mutants showed no compensatory increases when compared to wild‐type controls at 4 hpf (F,G) (*P < .05) (scale bar = 25 µm). hpf, hours postfertilization; qPCR, quantitative real‐time PCR |

ZFIN is incorporating published figure images and captions as part of an ongoing project. Figures from some publications have not yet been curated, or are not available for display because of copyright restrictions. PHENOTYPE:
|
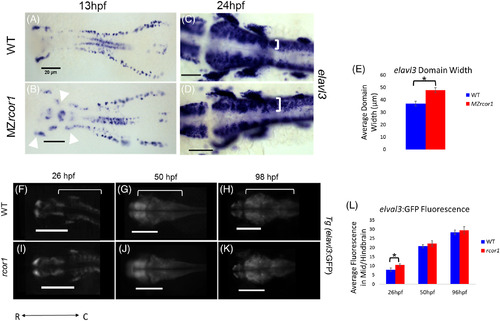
Enhanced neurogenesis in MZrcor1 mutants. Whole mount RNA in situ hybridization of MZrcor1 and related wild‐type embryos at 13 hpf (A,B) and 24 hpf (C,D) using elavl3 probe reveals ectopic expression of elavl3 in the midbrain and tegmentum at 13 hpf and increased expression along the midline from midbrain to tail at 24 hpf (as indicated by bar). Quantification of domain expression (indicated by bar graph). The average width of the elavl3 domain in the MZrcor1 was 47.7 ± 1.5 µm compared to 36.9 ± 2 µm for the wild‐type controls. E. Dorsal views of 26 hpf (F,I), 50 hpf (G,J), and 98 hpf (H,K) of Tg(elavl3:GFP);rcor1 sbu54/sbu54 mutants show increased differentiating neurons at 24 hpf in midbrain and hindbrain. L. Quantification of fluorescence levels of Tg(elavl3:GFP);rcor1 sbu54/sbu54 larva and sibling controls quantified at 26, 50, and 98 hpf (ROI indicated by white bracket). (*P < 0.05) (Scale bar = 20 µm). hpf, hours postfertilization EXPRESSION / LABELING:
PHENOTYPE:
|
|
ZFIN is incorporating published figure images and captions as part of an ongoing project. Figures from some publications have not yet been curated, or are not available for display because of copyright restrictions. |

MZrcor1 mutants have increased pro‐neural gene expression. A‐F. RNA in situ hybridization of MZrcor1 mutants and related wild‐type controls revealed that her6, has decreased expression pattern in the mutants at 13, 24, and 36 hpf. At 13 (G,J) and 24 hpf (H,K), ngn1, expression is more robust in the hindbrain of MZrcor1 mutants when compared to wild‐type control, while MZrcor1 mutants have increased zash1a expression at 36 hpf (N,P) compared to wild‐type controls. Quantification of expression domain at 13 hpf of her6 indicated that MZrcor1domain was 0.6 ± 0.06 µm in comparison to 1.11 ± 0.03 for wild type. Expression at 36 hpf of zash1a expression showed increased width in the MZrcor1 mutants (69.78 ± 3.5) when compared to controls (38.6 ± 2) (Q) (*P < .05) (scale bar = 20 µm). hpf, hours postfertilization EXPRESSION / LABELING:
PHENOTYPE:
|