- Title
-
Schwann cell precursors contribute to skeletal formation during embryonic development in mice and zebrafish
- Authors
- Xie, M., Kamenev, D., Kaucka, M., Kastriti, M.E., Zhou, B., Artemov, A.V., Storer, M., Fried, K., Adameyko, I., Dyachuk, V., Chagin, A.S.
- Source
- Full text @ Proc. Natl. Acad. Sci. USA
|
SCPs generate mesenchymal cells during murine embryonic development. (A–C) Genetic tracing of Plp1CreERT2;R26RConfetti/Confetti embryos revealed SCP contribution to proximal mesenchymal cells. Confetti clones expressing RFP, YFP, and/or CFP proteins are shown in A. The same tissue section was immunostained with PGP9.5 (for neuron) and GFP (for confetti) in B. (C) The traced cells off TUJ1+ nerves were positive for mesenchymal marker, PDGFRa. In A–C, arrowheads indicate traced cells on nerves and arrows indicate traced cells that become mesenchymal cells. |
|
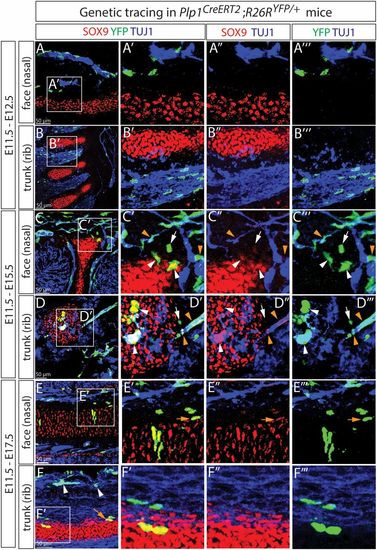
SCPs generate chondroprogenitors in craniofacial region and trunk during murine embryonic development. Genetic labeling in Plp1CreERT2;R26RYFP/+ embryos from E11.5 to E12.5 revealed no overlap between SCPs and SOX9+ chondroprogenitors (A and B). Prolonged tracing revealed appearance of SCP progeny in cartilage at E15.5 (C and D) and E17.5 (E and F). Orange arrowheads and white arrows indicate YFP+ cells on TUJ1+ nerves and close to nerves and cartilage, respectively, and white arrowheads indicate YFP+SOX9+ chondrocytes in C′ and D′. The orange arrow in E′ indicates an YFP+ perichondrial cell. These images represent at least 5 Cre+embryos from independent litters. A total of 5 facial and 2 trunk skeletal elements in each embryo were checked |
|
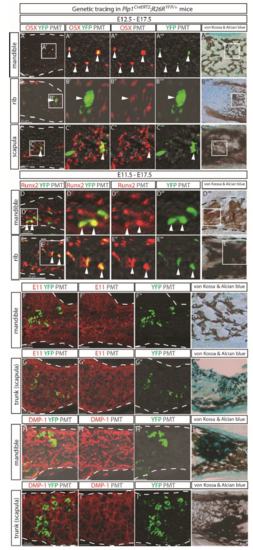
SCPs generate osteoprogenitor cells and osteocytes in facial region and trunk during murine embryonic development. (A–C) SCPs progeny in Plp1CreERT2;R26RYFP/+ embryos traced from E11.5 to E17.5 were positive for osteoprogenitor marker OSX in the ossified parts of mandible (A), rib (B), and scapula (C). The white arrowheads indicate double-positive cells. (D) Quantification of YFP+ cells among the OSX+ population. Data represent mean ± SEM where at least 3 embryos from independent litters were analyzed. (E and F) The same traced embryos were positive for Dmp1 RNA probe. A′′′′, B′′′′, and C′′′′ depict the same tissue sections as A–C but stained with von Kossa and Alcian blue (vK and Ab). The white dashed lines outline the mineralized portion of the bone. |
|
Control assessment of SCP labelling in Plp1CreERT2 mouse embryos (A-B) Genetic tracing of Plp1CreERT2;R26RYFP/+ embryos from E11.5 to E12.5, in combination with immunodetection of SOX10 (to visualize SCPs) and of TUJ1 (to visualize the nerves) revealed overlap between YFP+ cells and SCPs localized along the nerves in both facial region (A, nasal area shown) and the trunk (B, spine area shown), confirming genetic labeling of the peripheral glial cells with Plp1CreERT2 at this time. (C-D) One-day tracing of the Plp1CreERT2;R26RYFP/+ embryos from either E12.5 to E13.5 (C) or E15.5 to E16.5 (D) revealed comparable Cre recombination efficiency during the two tracing periods. Numbers show percentage of double Cre+YFP+ cells among Cre+. (E) Tracing in Plp1CreERT2;R26RConfetti/Confetti embryos from E12.5 to E13.5 revealed overlap between immunostaining for the CRE protein and the SOX10 marker for SCPs along the TUJ1+ nerves. (F) Immunodetection of confetti proteins with anti-GFP antibody revealed overlap between the Confetti+ cells and SOX10+ SCPs along the TUJ1+ nerves. (G-H) Tracing of Plp1CreERT2;R26RConfetti/Confetti embryos from E12.5 to E13.5 revealed no overlap between the Cre antibody staining (G) or retrieved Confetti signal (H) and the PDGFRa+ mesenchymal cells. |
|
Leakage control in Plp1CreERT2 mouse embryos (A-D) Genetic tracing of Plp1CreERT2;R26RYFP/+ embryos from E11.5 till E12.5 (A-B) or E17.5 (C-D) revealed 12.33% of the P0+ Schwann cells along the TUJ1+ nerves labeled genetically at E13.5, but the percentage increased to 56.56% at E17.5. (E-F) Plp1CreERT2;R26RYFP/+ did not genetically label tyrosine hydroxylase (TH)-positive neurons of the sympathetic ganglia (neural crest origin) when traced from E11.5 to E17.5 (E) or E12.5 to E17.5 (F). Neurofilaments were visualized with an antibody against NF200. (G) A representative scan of an entire E11.5 Plp1CreERT2;R26RYFP/+ embryo not injected with tamoxifen, shows no YFP signal other than auto-fluorescence from the internal organs and blood vessels. The laser power and digital gain were set at much higher levels (50%) than routine (around 6.5%) for visualization purposes . The white dashed lines outline the embryo. (H-I) Representative scans of sagittal facial sections of E17.5 Plp1CreERT2;R26RYFP/+ embryos either not injected with tamoxifen (H) or injected with corn oil at E11.5 (I), show no sporadic recombination in the absence of tamoxifen. The white dashed lines outline cartilage elements. |
|
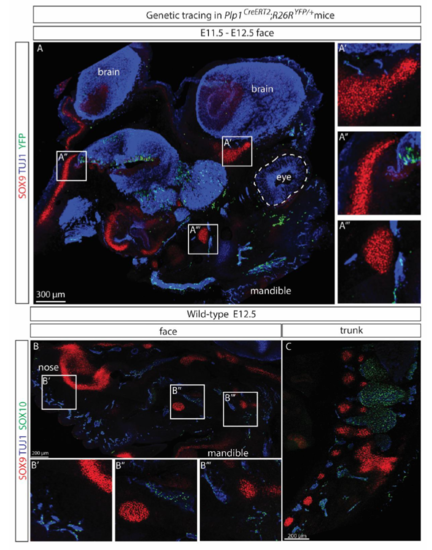
(A) A representative confocal scan of the entire face of an Plp1CreERT2;R26RYFP/+ embryo traced from E11.5 to E12.5 showed no overlap between YFP+ SCPs and chondro-progenitors revealed by immunostaining for SOX9. Nerves were visualized by TUJ1 immunostaining. (B-C) SOX9+ and SOX10+ cells were distinct populations on embryonic day E12.5 in both the facial region (B) and trunk (C, spine area shown) of wild-type C57BL/6J mice. |
|
(A-W) Genetic tracing of Plp1CreERT2;R26RYFP/+ embryos revealed contribution of SCPs to various craniofacial and trunk skeletons when injected with tamoxifen at E11.5 (A-G) or E12.5 (H-N), but not at E15.5 (O-U) and analyzed at E17.5. White arrowheads in (B-C) indicate YFP+SOX9+ cells that formed transversal columns. Orange arrows in (A-C) indicate YFP+ perichondrial cells. No contribution to the tibia growth plate was observed (W). Genetically labeled cells and chondrocytes were visualized with anti-GFP (green) and anti-SOX9 (red) antibodies, respectively. (V) Quantification of YFP+ cells among the SOX9+ cell population in different craniofacial and trunk structures of embryos genetically traced from E11.5, E12.5 or E15.5 to E17.5. Data represent mean ± SEM where at least 3 embryos from independent litters were analyzed. The white dashed lines outline the cartilage structures. (X) Collagen type II (COL2, red) immunostaining was employed to visualize cartilage elements, progeny of SCPs were visualized with anti-GFP (green) antibody and nerves with NF200 (blue) in Plp1CreERT2;R26RYFP/+ embryos injected tamoxifen either at E11.5 or E12.5 and analyzed at E17.5. (Y-Z) Comparison of R26RYFP homozygous (Plp1CreERT2;R26RYFP/YFP) to R26RYFP heterozygous embryos (Plp1CreERT2;R26RYFP/+, utilized throughout the study) revealed a significantly higher number of SCP progenies in cartilage elements of the homozygous embryos. Representative images (Y) and statistical analysis (Z) are shown for embryos labeled at either E11.5 or E12.5 and analyzed at E17.5. Genetically traced cells were visualized with an anti-GFP (green) antibody, cartilage cells with an anti-SOX9 (red) antibody and nerves with anti-TUJ1 antibody (blue). Data represent mean ± SEM, p values calculated with student’s t-test where at least 3 embryos from independent litters were analyzed. |
|
Sox10CreERT2;R26RConfetti/Confetti tracing analysis (A-D) Genetic tracing of Sox10CreERT2;R26RConfetti/Confetti embryos from E10.5 to E11.5, revealed no overlap between the traced YFP signal and SOX9+ chondroprogenitors (A-B) and co-localization between the YFP+ cells and the SOX10+ SCPs (C-D). (E-J) Genetic tracing of Sox10CreERT2;R26RConfetti/Confetti embryos from E10.5 to E17.5 revealed contribution to facial cartilage (E-F), scapula (G-H) and rib (I-J). Panels F, H and J depict the same tissue sections as panels E, G and I, but stained with von Kossa & Alcian blue following completion of confocal scans. The white dashed lines in E-I outline cartilage area. |
|
DhhCre;R26RTomato/+ tracing analysis DhhCre;R26RTomato/+ visualized cells only partially overlap with SOX10+ population of SCPs along TUJ1- posotive cells at E12.5 (A-B) and do not contribute to sympathoadrenal anlage visualized by tyrosine hydroxylase (TH) staining at E12.5 (C). The white dashed lines outline the structure of synpathoadrenal anlage. (D-H) DhhCre;R26RTomato/+ traced cells did not contribute to chondrogenesis either at E12.5 (D-E) or E17.5 (G-H). |
|
(A-C) In Plp1CreERT2;R26RYFP/+ embryos traced from E12.5 to E17.5 SCPs descendants were detected positive for osterix (OSX) marker for osteo-progenitors in the mandible (A), ribs (B) and scapula (C). Traced cells and OSX+ cells were visualized with an anti-GFP antibody (green) and anti-Osx antibody (red), respectively. The white arrowheads point to the double-positive cells. (D-E) The Plp1CreERT2;R26RYFP/+ embryos traced from E11.5 to E17.5 were stained with an anti-GFP antibody (green) and antibody against a pre-osteoblast marker RUNX2. (F-I) Domains enriched in osteocytes in the mandible (F, H) and scapula (G, I) in Plp1CreERT2;R26RYFP/+ embryos traced from E11.5 to E17.5 were visualized with antibodies against E11/gp38 osteocyte marker (F-G) or dentin matrix protein (DMP1) (H-I). Panels A""-E"" and F"'-I"' depict the same tissue sections as panels A-I, but stained with von Kossa & Alcian blue following completion of confocal scans. The white dashed lines outline the mineralized portion of the bone as indicated by the von Kossa & Alcian blue staining. |
|
(A-D) Cells immuno-stained positively for SOX10 (green) were seen to be located along tubulin (red)-positive nerves in both the vagal (A, C) and trunk (B, D) regions of wild-type AB zebrafish at 24 (A-B) and 48 (C-D) hpf. (E-F) Genetic tracing in Sox10CreERT2;Ubi:zebrabow zebrafish larva from 24 to 48 hpf revealed overlap between genetically labeled YFP+ cells (green) and SOX10+ cells (red) along the Tubulin+ nerves (blue) in both the vagal (E) and trunk (F) nerve regions. Arrowheads in (E-F) indicate examples of YFP and SOX10 double-positive cells. (G) Whole-mount skeletal preparation revealed appearance of the first alcian blue-positive condensation at the region of otic vesicle at 48 hpf and this area was further examined in Sox10CreERT2;Ubi:zebrabow zebrafish larva genetically traced from 24 to 48 hpf (H-J). Few YFP+ cells detached from the nerve were observed at this time-point, but those were not SOX9a+ (I), at the same time YFP+ and SOX9a+ double positive cells (highlighted by the white arrowheads) were observed tightly associated with the Tubulin+ nerve (J). (K-M) Genetic tracing in Sox10CreERT2;Ubi:zebrabow zebrafish after formation of SOX10+ cartilage elements, i.e., from 5 (K), 7 (L) or 11 dpf (M) until 44 dpf revealed a pattern of labeling that differed from that of SCPs labeled at 24 or 48 hpf (Fig. 4C-J). Images in A-F are single confocal slices of the stained samples. |
|
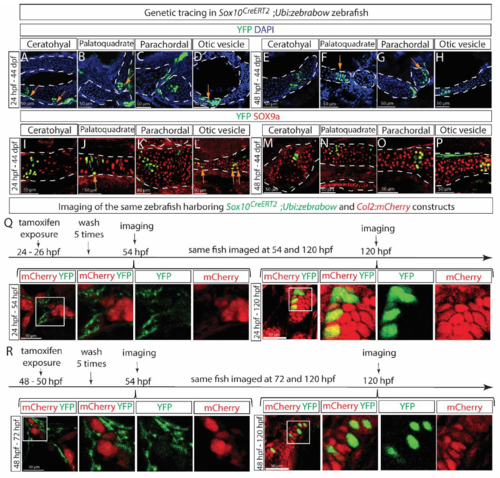
SCPs and Schwann cells give rise to craniofacial chondrocytes during the postnatal development of zebrafish. (A-P) Sox10CreERT2;Ubi:zebrabow zebrafish were exposed to 4OH-tamoxifen for 2 hours either at 24 hpf (A-D and I-L) or 48 hpf (E-H and M-P) and analyzed at 44 days post fertilization (dpf). Progeny of genetically-labeled SCPs were detected in various cartilage elements including ceratohyal (A, E, I, M), palatoquadrate (B, F, J, N), parachordal (C, G, K, O) and otic vesicle (D, H, L, P). Cartilage elements were visualized either by characteristic morphological appearance of DAPI-counterstained sections (A-H) or SOX9a (I-P). Orange arrows in A, B, D, F, G, J, L indicate YFP+ perichondrial cells. (Q) The Sox10CreERT2;Ubi:zebrabow zebrafish strain was crossed with the Col2:mCherry strain to visualize chondrogenesis simultaneously with genetic tracing of SCPs, exposed to 4OH-tamoxifen at 24-26 hpf and imaged live at 54 hpf followed by the same fish imaging at 120 hpf. No overlap between SCPs and cartilage cells was observed initially, but at 120 hpf. (R) The same experiment as in Q but with different initial labeling and detection time-points as indicated. Images in Q-R are single confocal slices of the stained samples. |


