
- Title
-
Yap/Taz-TEAD activity links mechanical cues to progenitor cell behavior during zebrafish hindbrain segmentation
- Authors
- Voltes, A., Hevia, C.F., Engel, C., Dingare, C., Calzolari, S., Terriente, J., Norden, C., Lecaudey, V., Pujades, C.
- Source
- Full text @ Development

Hindbrain boundary cells display Yap/Taz activity. (A-C) Whole-mount double in situhybridization in embryos at the indicated developmental stages with probes targeting: egr2a(A,C), which labels rhombomeres (r) 3 and 5; hoxb1a (B,C), which labels r4; and rfng (A,B), which labels hindbrain boundaries. The expression of rfng is restricted at the interface between adjacent rhombomeres. (D) BrdU staining of a Mu4127 embryo expressing mCherry (magenta) in r3 and r5 at 18 hpf. Cells at the boundaries (at the border of mCherry expression) display green BrdU staining (white arrowheads indicate examples). (E) Immunostaining of a Tg[elA:GFP] embryo at 24 hpf with anti-pH3 (magenta). Nuclei were stained using Draq5 (gray). Cells at the boundaries (at the border of GFP expression) display pH3 staining (see white arrowheads). (F) A still image from a time-lapse analysis of a double transgenic Tg[CAAX:GFP]Mu4127 embryo displaying GFP in the plasma membrane (shown in white) and mCherry in r5 (shown in magenta). T1-T3 are enlargements of the region framed in F, corresponding to different times. Upon division, the cell challenges the boundary when it undergoes mitosis. (G) Tg[4xGTIIC:GFP] embryo injected with H2B-mCherry to visualize cell nuclei, which display Yap/Taz-TEAD activity (green) in discrete progenitor domains of the hindbrain at 36 hpf. Cells of the rhombic lip (rl) are devoid of Yap/Taz activity. (H) Tg[4xGTIIC:GFP]Mu4127 embryos showing that TEAD activity is restricted to the boundary cells. Images on the right are enlargements of the r3/r4 (white arrow indicates a Yap/Taz-active r3 cell) and r5/r6 (white arrowhead indicates an r6 cell with Yap/Taz activity) boundaries framed in H. (I,I′) Tg[4xGTIIC:GFP] embryos immunostained using anti-Sox2 antibodies (magenta), showing that green Yap/Taz-TEAD active cells are located in the ventricular zone and express this progenitor cell marker (I′). (J-K″) Whole-mount anti-Yap (J-J″) and anti-Taz (K-K″) immunostaining of Tg[4xGTIIC:GFP] embryos at 25 hpf showing overlapping expression of Yap and Taz (magenta in J,J″,K,K″) with TEAD activity (green cells in J′,J″,K′,K″) in boundary cells. All images are dorsal views with anterior to the left, except for the transverse views in I′,I″. r, rhombomere; rl, rhombic lip; ov, otic vesicle. Scale bars: 50 µm. EXPRESSION / LABELING:
|
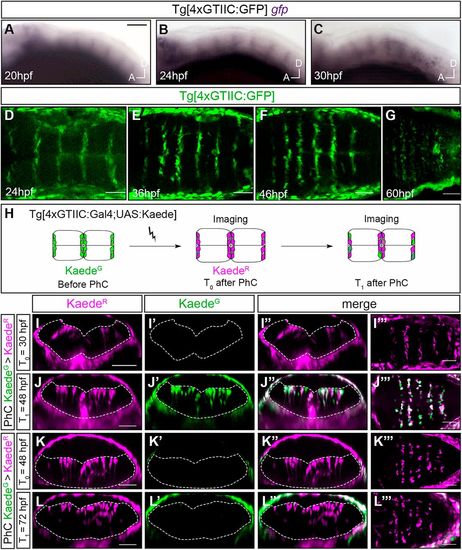
Onset/offset of Yap/Taz-TEAD activity in the hindbrain boundaries. (A-C) Tg[4×GTIIC:GFP] embryos at the indicated stages assayed for a whole-mount in situ hybridization using a gfp RNA probe. Expression of gfp, and therefore Yap/Taz-activity, is already visible in the boundaries at 20 hpf. Lateral views with anterior to the left. (D-G) Expression of GFP in the hindbrain boundaries in Tg[4xGTIIC:GFP] embryos at the indicated stages. GFP is first observed at 25 hpf. GFP expression persists for up to 72 hpf (data not shown). Dorsal views with anterior to the left. (H) Scheme depicting the photoconversion experiment: KaedeG in the hindbrain boundary cells of Tg[4xGTIIC:Gal4FF;UAS:KAEDE] embryos was photoconverted to KaedeR at T0, and embryos were allowed to develop up to the desired stage (T1). (I-I″,J-J″) Embryo in which KaedeG was photoconverted to KaedeR at T0=30 hpf (I-I″) and which was analyzed at T1=48 hpf (J-J″). New KaedeG is generated in cells between 30 hpf and 48 hpf (see merged channels in J″,J‴). (K-L″) Embryo in which KaedeG was photoconverted to KaedeR at T0=48 hpf (K-K″) and which was further analyzed at T1=72 hpf (L-L″). No new KaedeG-expressing cells were observed after photoconversion (L-L‴), suggesting that the decline of Yap/Taz-activity was before 48 hpf. (I-I″,J-J″,K-K″,L-L″) Reconstructed transverse sections of embryos are displayed in I‴,J‴,K‴,L‴ as dorsal views with anterior to the left. Scale bars: 30 μm in A-C; 50 μm in D-G,I-L″′. EXPRESSION / LABELING:
|

Yap and Taz in the hindbrain boundaries sense mechanical cues. (A-C,G,H) Whole-mount gfp in situ hybridization of Tg[4×GTIIC:GFP] embryos treated with DMSO (A), with myosin II pharmacological inhibitors such as blebbistatin (B) and rockout (C) from 16 to 22 hpf, or injected with MO-control (G) or MO-Rac3b (H) in order to downregulate Rac3b. In all distinct experimental cases, gfp expression, and therefore Yap/Taz activity, is downregulated in the hindbrain boundaries and is not affected in the somites. (D-F) Whole-mount rfng in situhybridization of Tg[4xGTIIC:GFP] embryos treated with DMSO (D), blebbistatin (E) or rockout (F). Expression of boundary markers is not affected upon treatment, as previously shown (Gutzman and Sive, 2010). Lateral views with anterior to the left. (I-K) Downregulation of Rac3b by clonal analysis. (I) Scheme depicting the functional experiment in which Tg[4xGTIIC:GFP] embryos were injected at the one-cell stage with inducible Myc-tagged constructs (hsp:Myc or Myc:hsp:Rac3DN), heat-shocked at 14 hpf, allowed to develop until 30 hpf, and immunostained for GFP and Myc. For the phenotypic analysis, we scored the percentage of Myc-expressing clones (Myc-positive) hitting the boundaries that displayed Yap/Taz-TEAD activity (GFP-positive) and this was plotted in K. (J-J″) Example of a Tg[4xGTIIC:GFP] embryo injected with Myc:hsp:Rac3DN and immunostained using anti-GFP (green) and anti-Myc (magenta) antibodies. Myc-positive cells, when located within the boundaries, display low (see arrows) or no (see arrowheads) GFP-expression. On the right are images from the regions framed in J-J″ showing a magnified boundary in which the Yap/Taz-TEAD activity has been either completely abolished or downregulated upon expression of Rac3DN. Dorsal view with anterior to the left. (K) The percentage of boundary cell clones expressing Yap/Taz-TEAD activity (GFP-positive clones) are displayed in dark gray in the histogram, over the total Myc-positive clones displayed as light gray in the histogram, either in control (hsp:Myc) or experimental conditions (Myc:hsp:Rac3DN) where the actomyosin cables were compromised. When Rac3b is downregulated, the percentage of Myc-positive clones with Yap/Taz-TEAD activity decreases. (L-O′) Tg[4xGTIIC:GFP] embryos treated with DMSO (L,L′,N,N′) or with blebbistatin (M,M′,O,O′) from 19-25 hpf, and immunostained using anti-Yap (L,M) or anti-Taz (N,O) antibodies, and analyzed for TEAD activity (L′,M′,N′,O′). Expression of GFP and Yap and Taz in the boundary cells is abolished upon blebbistatin treatment. Dorsal views with anterior to the left. r, rhombomere. n=X/Y indicates the number of embryos with the displayed phenotype (X) over the total number of analyzed embryos (Y). Scale bars: 200μm in A-H; 50μm in J-J″,L-O. EXPRESSION / LABELING:
PHENOTYPE:
|

Boundary cells switch their proliferative behavior over time. (A) Scheme depicting the outline of the experiment: Tg[4xGTIIC:GFP] embryos were injected at the one-cell stage with hsp:H2B-RPF and heat-shocked at 26 hpf, or were injected at the eight-cell stage with H2B-mCherry (not shown). Embryos displaying red nuclei within the Yap/Taz-active boundary cells were then imaged up to the desired stage (Fig. S2). (B) Representation of the Yap/Taz-TEAD active cell lineage tree with the y-axis displaying the time of embryonic development in hours post-fertilization (hpf). The 63 cell lineages are displayed from the moment of tracking onwards and are color-coded according to proliferative behavior (orange, dividing; black, non-dividing). Each line corresponds to a single cell tracked starting from the beginning of the movie until the end (Table 1); branches indicate cell divisions. An interrupted line means either the end of the movie or that the cell was lost from the field. There is a switch in cell proliferative behavior from 40 hpf onwards, from which time most of the 4xGTIIC:GFP cells do not divide and therefore do not branch. Yap/Taz-active derivatives can be tracked beyond Yap/Taz-TEAD activity due to the stability of the GFP protein. (C,C′) Stills from a time-lapse movie that followed a single cell from 26 hpf to 48 hpf; the cell underwent two cell divisions giving rise to four cells (Movie 1). (D,D′) Representative example of a group of three cells photoconverted at 48 hpf and followed until 72 hpf. The number of cells does not change during this 24 h period, supporting the previous observation of a switch in cell proliferation behavior. (E) Graph showing the percentage of cells undergoing cell division over time in different hindbrain cell populations: Yap/Taz-TEAD proliferating boundary cells (black circles and dashed line); atoh1a-positive rhombomeric cells (gray triangles and solid line) and neurog1-positive cells (black square) in the flanking boundary regions. There is a difference in the percentage of cells undergoing mitosis in boundaries (19%) versus other hindbrain territories (atoh1a-positive cells, 11.5%; neurog1-positive cells, 8.5%) at 26 hpf; the boundary cell population dramatically changes its proliferative behavior after the offset of Yap/Taz-activity (5.7% at 40 hpf). (F) Images showing the development of the neuronal differentiation domain in Tg[HuC:GFP] embryos from 26 hpf to 70 hpf. (G) Histogram displaying the actual size of the progenitor versus neuronal domains at the indicated stages. Data were obtained from Tg[HuC:GFP] embryos whose apicobasal (AB) length was measured (the length extending from the apical ventricular zone edge to the basal mantle zone according to cell orientation within the neural epithelium; n=8-10 boundaries of four or five embryos/stage). There is a dramatic increase in the size of the neuronal domain at the expense of the progenitor domain over time. (H) Comparison of the two methods used for growth assessment. The ratio of distances measured between the apical/ventricular and basal/mantle borders of the HuC domain (black circles and dashed line) versus the measurement of the HuC area (gray triangles and solid line) of an average of 12-18 boundaries (6-9 embryos) is shown. These two approaches provide equivalent estimates of progenitor/neuronal domain progression. (I) Analysis of the position along the apicobasal axis of the nuclei of cells tracked in B at different times. Positional values were plotted (magenta dots) and overlaid with the information obtained from the progenitor/neuronal map. Briefly, nuclear position was scored by measuring the distance from the cell nucleus to the apical side, according to the drawing, and the result was normalized taking into consideration the thickness of the neural tube (see Materials and Methods). Most of the cell nuclei lay within the progenitor domain (light-gray zone) at 26 hpf, whereas at 70 hpf they were mainly located in the neuronal differentiated domain (dark-gray zone). (J-J″) Immunostaining of Tg[4xGTIIC:Gal4;UAS:KAEDE] embryos using anti-HuC antibodies at 50 hpf, showing derivatives of Yap/Taz-active cells within the HuC-positive domain. Although cells within the neuronal domain are not active for Yap/Taz (as shown in Fig. 2), their derivatives can be tracked due to the stability of the KAEDE protein. Scale bars: 50 µm. |

ZFIN is incorporating published figure images and captions as part of an ongoing project. Figures from some publications have not yet been curated, or are not available for display because of copyright restrictions. PHENOTYPE:
|

Distinct features of boundary cells. A-D’’) Double in situ hybridization for detection of the expression of the rfng boundary marker, and either the hoxb1a r4 marker (B) or the egr2 r3 and r5 marker (C-D’’). Note that rfng is not yet expressed at 15hpf, and that, once it is expressed, rfng is stained in two cell rows: one cell row that expresses hoxb1a/egr2a together with rfng, and the other that expresses only rfng (see cells with white arrows in B-C, and D-D’’). E) Tg[CAAX:GFP]Mu4127 and F) Tg[CAAX:GFP] embryos showing that cells at the boundaries display a singular triangular shape (see white arrows). G) Tg[CAAX:GFP]Mu4127 embryos were used for single cell segmentation. Inserts are images of single segmented cells from the framed regions (green and blue) indicated in the embryo. They display dorsal (top) and lateral (bottom) views of manually segmented single cells from the r3/r4 boundary (green cells) and from r4 (blue cells), with the apical side at the left of the image. Note that the green r3/r4 cell has a triangular shape with a large apical side, whereas the blue r4 cell is spindle-shaped. H-H’’) Tg[elA:GFP] embryos expressing GFP in r3 and r5 were assayed using rfng fluorescence in situ hybridization and immunostaining for GFP. Note that rfng is expressed at the border of GFP expression, i.e. in the boundary cells. I-I’’) Tg[elA:GFP] embryos expressing GFP in r3 and r5 were assayed using ephA4 fluorescence in situ hybridization and immunostaining for GFP. Note the complete overlap of ephA4 and GFP expression, as previously described, which reflects the fact that ephA4 is a direct transcriptional target of egr2. Dorsal views with anterior to the top. r, rhombomere. |

Loss-of-function of Yap and Taz: morpholinos and genomic edition of yap and wwtr1 genes by TALEN technology. A) Scheme depicting the structure of the different employed mopholinos. MO-Yap: position of the splice-blocking morpholino (MO-Yap1SB2e2i, black line), and the primers used to assess its efficiency (see green and red arrows). MO-Wwtr1 is a translation-blocking morpholino for Taz. B) Agarose gel showing the aberrant splicing products induced by MO-Yap as detected by RT-PCR of embryos injected with either MO-control or MO-Yap1. C-D) Embryos injected with either MO-control or MO-Yap1 and in situ hybridized for myl7. Note that upon downregulation of Yap1, embryos displayed defects in the migration of heart progenitors (compare C-C’ with D-D’) as previously described (Fukui et al., 2014). Whole embryo dorsal (C-D) or ventral (C’-D’) views with anterior to the top. E-F) Embryos injected with either MO-control or MO-Wwtr1 and immunostained with anti-Taz. Note that Taz protein expression is downregulated in the MO-Wwtr1 injected embryos demonstrating that MO-Wwtr1 does indeed interfere with the translation of Taz. G-I) Analysis of Yap/Taz-TEAD activity in embryos where Yap or Taz was downregulated using morpholinos (MO-control: n = 16; MO-Yap: n = 23; MO-Wwtr1: n = 26). Note that no effects on Yap/Taz-TEAD activity were observed when either cofactor was downregulated alone. Embryos injected with MO-Yap and MO-Wwtr1 resulted in severe malformations and did not progress until the analysis stage. Images in (E-J) are hindbrain dorsal views with anterior to the top. J) Alignment of the yapfu48 and wwtr1fu55 mutant alleles with their corresponding wild-type (yap+/+ and wwtr1+/+) sequences showing: i) the deleted nucleotides, and ii) the TALEN target sites in the yap and wwtr1 loci; the left and right arms (magenta) of these sites are separated by a spacer (black) including the restriction site used for screening (orange). K-L) Agarose gels with the obtained bands resulting from enzyme restriction mapping of gDNA corresponding to embryos carrying the wild type or the mutated alleles. The numbers in red indicate the size of the different obtained fragments. M-N) yapfu48/+wwtr1+/+ and sibling yapfu48/+wwtr1fu55 compound mutants in the TEAD-activity reporter background. Note that embryos in which three of the yap/wwtr1 alleles were mutated (yapfu48/+wwtr1fu55) do not display Yap/Taz-TEAD activity in the hindbrain boundaries (n=12/14), in comparison with control embryos (yapfu48/+wwtr1+/+, n=14/14 with TEAD-activity). Double homozygous yapfu48wwtr1fu55 embryos displayed severe deformations and did not survive until the analysis stage. Scale bars correspond to 50m. |