
- Title
-
Tubgcp3 Is Required for Retinal Progenitor Cell Proliferation During Zebrafish Development
- Authors
- Li, G., Jin, D., Zhong, T.P.
- Source
- Full text @ Front. Mol. Neurosci.
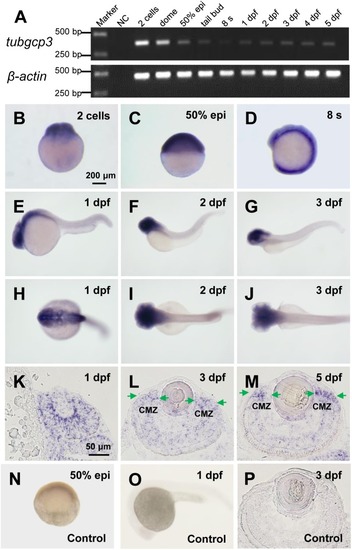
Expression of tubgcp3 during zebrafish early development. (A) Semi-quantitative RT-PCR analyses showing the expression of zebrafish tubgcp3 from 2-cell stage to 5 days post-fertilization (dpf). β-actin was used as the internal control. (B–D) Whole-mount in situhybridization (WISH) displaying ubiquitous expression of tubgcp3 at the two-cell stage (B), 50%-epiboly (C) and 8-somite stage (8 s) (D). (E–J) From 1 to 3 dpf, the expression of tubgcp3becomes concentrated at the head. (K–M) In situ hybridization (ISH) of zebrafish retinal cryosections exhibit the expression of tubgcp3 throughout the whole retina at 1 dpf (K). From 3 dpf, its expression is enriched at the ciliary marginal zone (CMZ) (L,M). (N–P) No positive staining is detected with the sense probe. Arrows indicate the CMZ of the retina. Scale bars: 200 μm (B–J,N,O); 50 μm (K–M,P). |

CRISPR/Cas9-mediated tubgcp3 knockout results in zebrafish developmental defects. (A) Sanger sequencing displaying a 5-base pair (bp) deletion in tubgcp3 gene in the zebrafish mutants. The black box indicates the deletion. (B)Predicted structure and amino acid sequence of the wild-type and the mutant alleles of Tubgcp3. The 5-bp deletion in tubgcp3 gene was predicted to generate a 99 amino acid (aa)-truncated Tubgcp3 protein without the GRIP1 domain (green box) and GRIP2 domain (purple box). (C) Western blotting analysis showing Tubgcp3 protein decreased in tubgcp3 mutant embryos at 5 dpf. (D) Whole-mount lateral views of the tubgcp3 mutant and sibling embryos at the indicated developmental stages. (E) Higher magnification of the lateral and dorsal views of zebrafish heads from siblings and tubgcp3mutants at 3 and 5 dpf. The brain size is measured based on the fluorescent area in the head of Tg(HuC:GFP). Red dotted lines indicate the brain area of the embryos used for analysis. (F,G) Scatter plot of eye and head size from wild-type siblings and tubgcp3 mutants at 3 and 5 dpf. Data are from 29 embryos for each group. Student’s t-test: ∗∗P < 0.01. Scale bars: 1 mm (D); 200 μm (E). EXPRESSION / LABELING:
|

The tubgcp3 mutants exhibit developmental defects in the CMZ of the retina. (A–D) Hematoxylin and Eosin (HE) staining displaying significant defects in the CMZ of the tubgcp3 mutant retinae at 3 dpf and 5 dpf. (E–H) Higher-magnification images of the CMZ in blue dotted rectangles in (A–D). (I–L) Higher-magnification image of the orange dotted rectangles in (A–D). The tubgcp3 mutants exhibit normal retinal laminar structures in the central retina. GCL, ganglion cell layer; IPL, inner plexiform layer; INL, inner nuclear layer; OPL, outer plexiform layer; ONL, outer nuclear layer; RPE, retinal pigment epithelium. Scale bars: 100 μm (A–D); 20 μm (E–L). PHENOTYPE:
|
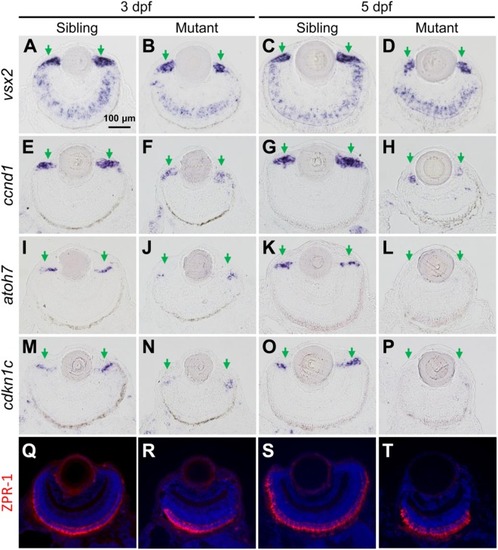
The tubgcp3 mutant embryos exhibit decreased expression of proliferation and differentiation markers in CMZ cells. (A–D) ISH analyses show that the expression of vsx2 is normal in the central retina but significantly reduced in the CMZ in tubgcp3mutant retinae at 3 dpf and 5 dpf. (E–H) ISH analyses exhibit that ccnd1 is highly expressed in wild-type sibling CMZ (M,O) but clearly reduced in tubgcp3 mutant CMZ (N,P) at 3 dpf and 5 dpf. (I–P) atoh7 and cdkn1c (associated with retinal cell differentiation) are expressed in the central CMZ of wild-type sibling retina but significantly reduced in tubgcp3 mutant CMZ at 3 dpf and almost disappeared at 5 dpf. (Q–T) Immunostaining analyses displaying normal ZPR-1 staining (green/red double cone photoreceptors marker) in the central area of the tubgcp3 mutant retina. Arrows indicate the CMZ of the retina. Scale bars: 100 μm (A–T). EXPRESSION / LABELING:
PHENOTYPE:
|
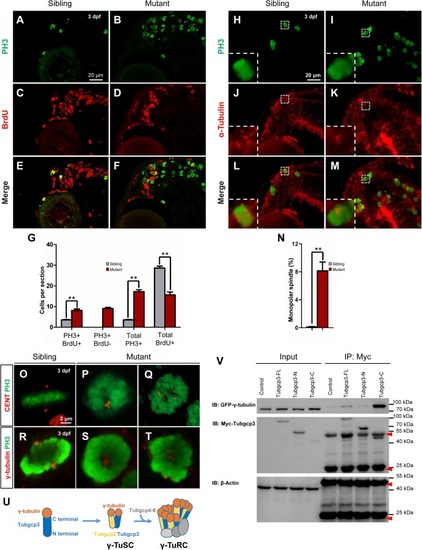
The tubgcp3 mutant CMZ cells arrest in M-phase showing monopolar spindles and abnormal distributed centrioles and γ-tubulin. (A–F) Immunostaining analysis of cell proliferation in zebrafish retina at 3 dpf using DNA replication marker (BrdU, red) and mitotic marker (PH3, green). Embryos are incubated with BrdU for 6 h before being collected at 72 hpf for the analysis. Almost all cells in wild-type sibling CMZ are BrdU+ with several PH3+ cells among them (A,C,E). In the (tubgcp3 mutant retina, PH3+ cells are significantly increased (B,F), but BrdU+ cells are markedly decreased (D,F). Note that PH3+ BrdU- cells are detected in the tubgcp3 mutant retina (F) but absent in the wild-type sibling (E). (G)Bar chart analyses depicting quantification of BrdU- and PH3-labeled cells in wild-type sibling and tubgcp3 mutant retinae. Data are mean + SEM from 50 retinal sections for each group. Student’s t-test: ∗∗P < 0.01. (H–M) Immunostaining of 3 dpf retinal cryosections with anti-α-tubulin (red) and anti-PH3 (green) displaying bipolar spindles formed in mitotic cells in wild-type siblings (H,J,L). In the tubgcp3 mutant retina, many mitotic RPCs exhibit monopolar spindles (I,K,M). Insets indicate high-magnification images of mitotic RPCs in rectangles in (H–M). (N) Bar charts depicting quantification of mitotic cells with monopolar spindles in wild-type sibling (0.12 per section, n = 43 sections) and the tubgcp3 mutant retinae (8.14 per section, n = 36 sections). (O–Q)Immunostaining analyses displaying a pair of centrioles at each pole of the bipolar spindle in mitotic cells in wild-type sibling CMZ (O). In the tubgcp3 mutant retinae, centrioles are distributed at the center of the M-phase arrested cells (57.6%, n = 59 M-phase arrested cells) (P) or randomly scatter in these cells (42.4%, n = 59 M-phase arrested cells) (Q). (R–T) Immunostaining analyses exhibiting γ-tubulin at the spindle poles in mitotic cells in wild-type sibling (R). In tubgcp3 mutant retinae, γ-tubulin localizes at the center of the M-phase arrested cells, showing a single focus (62.5%, n = 80 M-phase arrested cells) (S) or scattered foci (37.5%, n = 80 M-phase arrested cells) (T). (U) Schematic representation of the structure of γ-TuSC and γ-TuRC. (V) Co-immunoprecipitation (IP) assays showing Tubgcp3 interacts with γ-tubulin through its C terminal domain. HEK293T cells were transfected with plasmids to express GFP-tagged zebrafish γ-tubulin and Myc-tagged zebrafish Tubgcp3 fragments, including full length (1–906 aa) Tubgcp3, N terminal (1–551 aa) Tubgcp3 and C terminal (552–906 aa) Tubgcp3. Then the cell samples were performed by immunoprecipitation with anti-Myc antibody and analyzed by immunoblotting (IB) with anti-Myc and anti-GFP antibodies. β-Actin was used as the loading control. Arrowheads indicate the IgG heavy chain (∼50 kDa) and IgG light chain (∼25 kDa). Scale bars: 20 μm (A–F); 20 μm (H–M); 2 μm (O–T). EXPRESSION / LABELING:
PHENOTYPE:
|

Tupgcp3 deficient cells undergo apoptosis and senescence. (A–H) Immunostaining analyses displaying significantly increased TUNEL+ cells in the tubgcp3 mutant retina (D,F,H)at 3 dpf compared to wild-type sibling (C,E,G). Note the increased PH3+ cells in the tubgcp3mutant retina do not co-localize with the TUNEL+ cells (F,H). (I) Bar chart analyses depicting quantification of TUNEL+ cells in wild-type sibling and the tubgcp3 mutant retinae. (J–Q)Immunostaining analyses exhibiting markedly increased γ-H2AX+ cells in the tubgcp3 mutant retina (M,O,Q) at 3 dpf compared to wild-type sibling (L,N,P). Note that some of the (increased PH3+ cells overlap with the γ-H2AX+ cells in the tubgcp3 mutant (O,Q). Arrows mark the PH3 and γ-H2AX double positive cells in the tubgcp3 mutant retina. Arrowheads indicate the location of RSCs in the CMZ of the retina. (R) Bar chart analyses depicting quantification of γ-H2AX+ and PH3+ cells in wild-type sibling and the tubgcp3 mutant retinae. Data are mean + SEM from 30 sections for each group. Student’s t-test: ∗∗P < 0.01. (S–T”) ISH and immunostaining analysis of cell proliferation at the extreme periphery of CMZ at 5 dpf. Zebrafish embryos were incubated in BrdU for 24 h before collected at 5 dpf for the double staining assay. In the wild-type sibling, there are many BrdU+ cells in col15a1b-labeled region (S,S’,S”). In contrast, BrdU+ cells are significantly decreased in this region in the tubgcp3 mutant CMZ (T,T’,T”). (U–X)Senescence-associated β-galactosidase (SA-β-gal) staining exhibiting increased β-galactosidase activity at the CMZ in the tubgcp3 mutant (V) compared to the wild-type sibling (U). Nuclei are stained with DAPI (W,X). Insets indicate high-magnification images of the peripheral edge of CMZ in rectangles in (U–X). (Y) Bar chart analyses depicting quantification of BrdU+ cells in the col15a1b-labeled region in wild-type sibling and the tubgcp3 mutant CMZ. Data are mean + SEM from 36 sections for each group. Student’s t-test: ∗∗P < 0.01. Scale bars: 20 μm (A–H); 20 μm (J–Q); 20 μm (S–T”); 50 μm (U–X). EXPRESSION / LABELING:
PHENOTYPE:
|