- Title
-
Neuronal Architecture of a Visual Center that Processes Optic Flow
- Authors
- Kramer, A., Wu, Y., Baier, H., Kubo, F.
- Source
- Full text @ Neuron
|
Co-registration of FuGIMA with Two Functional Imaging Datasets Shows Overlap of DS-RGC Input with Monocular DS, but Not with Translation-Selective, Neurons (A) Schematic illustrating acquisition and integration of the functional maps and the FuGIMA dataset. (B–I) A slice of the co-registered volume at the level of the AFs 4–6 with FuGIMA tracings and functional maps of DS-RGC terminals and DS neurons (right hemisphere, maximum intensity projection over z = 10 μm; see schematic in F; of 58 FuGIMA tracings, 42 of the following classes extend into the slice: 19 monocular DS; 17 translation-selective; 6 not motion-sensitive). (B–E) FuGIMA tracings (open white arrowhead, FuGIMA tracing bundle; filled white arrowhead, small tracing patch at the border between AFs 5 and 6; open arrow, direction of oblique view): (B) all (white); (C) monocular DS (green); (D) translation-selective (magenta); and (E) non-motion-sensitive (blue). (F) Schematic of z stack slicing (oblique view used to visualize optic tract [light gray] and AFs [dark gray]). (G) Registered 3D map of DS-RGC terminals (isl2b:Gal4, UAS:syGCaMP6s; see color wheel below for direction of moving gratings presented from side; composite of 6 fish). (H) Registered 3D map of DS-panneuronal (HuC:GCaMP5G; white arrow, broad band of DS pixels; see color wheel below for direction of moving gratings presented from below; composite of 5 fish). (I) Composite of DS-panneuronal with all FuGIMA tracings and standard brain reference marker (HuC:lyn-tagRFP in gray). For (G)–(I), imaging artifact DS pixels located in the eye were removed with a mask. Scale bar represents 50 μm (I). |
|
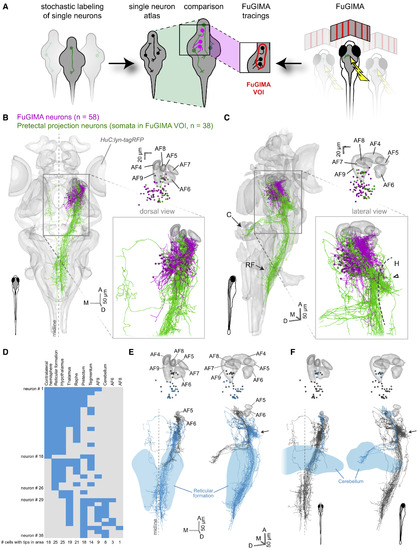
Pretectal Projection Neurons Target the Cerebellum and Ventral Hindbrain (A) Schematic illustrating the strategy to combine the single-neuron atlas of Kunst et al. (2019) and the FuGIMA dataset. (B and C) 3D representation of the standard brain (HuC:lyn-tagRFP) together with all FuGIMA neurons (magenta, n = 58) as well as pretectal projection neurons (PPNs) (green, n = 38), chosen based on their soma location within the FuGIMA “volume-of-interest” (FuGIMA VOI) (Figure S7). (B) (Left, dorsal view, top right) Dorsal view of cell bodies with AFs 4–9; (bottom right) detail of tracings. (C) As (B) but lateral view (C, cerebellum; H, hypothalamus; RF, reticular formation; dashed line, dorsal border of hypothalamus; open arrowhead, dense branching of PPNs). (D) Intersection analysis of PPNs with annotated brain areas, i.e., contralateral hemisphere, reticular formation, hypothalamus, thalamus, raphe, pretectum, tegmentum, AF9, cerebellum, AF6, and AF8. Each row represents one neuron; blue filled rectangles symbolize intersection with the annotated brain area. (E) 3D rendering of intersection of PPNs with the reticular formation (blue, intersecting tracings [n = 25 of 38 PPNs]; gray, not intersecting PPNs; light blue, reticular formation; top, somata and AFs 4–9; bottom, tracings and AFs 5 and 6; left, dorsal view; right, lateral view; arrow, dense branching area in dorsal hypothalamus). (F) As (E) but intersection of PPNs with the cerebellum (blue, intersecting tracings [n = 8 of 38 PPNs]; light blue, cerebellum). |
|
Characterization of paGFP activation in . single cells, registration procedure of tracings and alignment precision of landmarks. (A) Application of the FuGIMA photoactivation protocol in a single spinal cord neuron coexpressing UAS:FuGIMA and UAS:tdTomato-CAAX (driver: Gal4s1101t). Photoactivation in a single spinal cord neuron, pre- and post-photoactivation with a single activation cycle (brightness/contrast adapted separately). (B) Lateral views of the tail with the photoactivated neuron extending from the spinal cord after full photoactivation protocol of 15 cycles. (Inset: rectangle on fish schematic indicates the field of view. Green: nls-GCaMP6s/paGFP, magenta: tdTomato-CAAX, white arrow: soma of photoactivated neuron, arrowhead: filled neurite). (C) Time course of paGFP brightness in the soma over the course of 15 cycles of photoactivation (n = 5 pretectal neurons in 3 fish, mean +/- STD). (D) Workflow of image registration enabling visualization of FuGIMA neurons in the standard brain. Experimental z stacks are split into two separately processed channels. Neurons are traced in the nls-GCaMP6s/paGFP channel and tracings of neurons imaged at both the two-photon (2p) and the confocal microscope are merged. In parallel, the reference marker channel (HuC:lyn-tagRFP) is registered to the standard brain (averaged HuC:lyn-tagRFP). The resulting registration files are applied to tracings (coregistration), enabling their visualization within the volume of the standard brain. (E) Quantification of distances between the location of landmarks in the standard brain and in the registered experimental fish. Left: combined box plot and swarm plot (middle horizontal line: median, horizontal box outlines: first and third quartile, whiskers: last points included in 1.5 * interquartile range from the respective quartile), right: 3D rendering of landmarks in the standard brain (gray surface: reference marker HuC:lyn-tagRFP, dark gray: landmark position in standard brain, colors: registered landmarks from experimental fish, n = 8 z stacks from 6 fish for LM 1 – 9 and 11, n = 6 z stacks from 4 fish for LM 10, middle: dorsal view, black arrow: viewing direction for lateral view, shown on the right, LM, landmark). Scale bar: 5 μm in (A), 50 μm in (B). |
|
Image registration work flow to generate a 3D map of direction-selectivity, characterization of isl2b:Gal4, UAS:syGCaMP expression and overlay from image registration. (A) Schematic workflow for registering functional responses with anatomical structures. For clarity, only 3 preferred directions are represented here. See STAR Methods for details. (B, C) Subcellular localization of syGCaMP6s in the tectum/AF10 (B) and AF4, AF5 and AF6 (C) in isl2b:Gal4, UAS:syGCaMP6s, UAS:mCherry fish. Note that syGCaMP6s expression exhibits punctate signals in RGC terminals, in contrast to uniform mCherry signals in en passant RGC axon bundles. SO, stratum opticum; SFGS, stratum fibrosum et griseum superficiale; SGC, stratum griseum centrale; SAC, stratum album centrale. (D) Schematic illustration of AFs (modified from Burrill and Easter (1994)). Blue dotted lines indicate approximate z-planes shown in other panels of this figure. OT, optic tract. (E) Lipophilic dye DiI injection of the RGC axons in isl2b:Gal4, UAS:Dendra-kras fish. Note that the isl2b:Gal4 line labels most of RGCs projecting to AF4, AF5 and AF6. (F-K) Overlay of 6 different transgenic fish (isl2b:Gal4, UAS:syGCaMP6s, UAS:mCherry) that have been registered into a reference system (RGC standard brain based on isl2b:Gal4, UAS:mCherry). Z-position indicates the distance from the dorsal most surface of AF10. Note that both syGCaMP6s (F-H) and mCherry (I-K) patterns from 6 fish occupy conserved space in the registered volume. A, anterior; P, posterior; D, dorsal; V, ventral, M, medial. Scale bars represent 30 μm. |
|
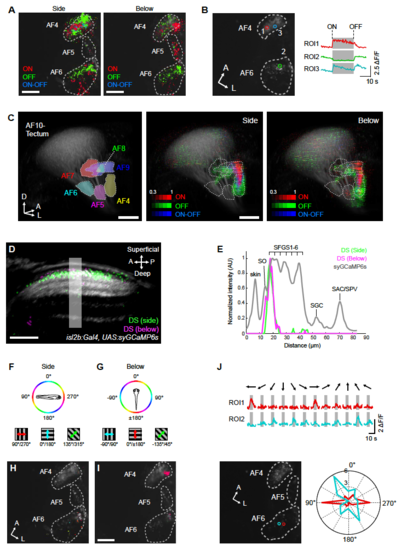
Mapping of orientation-selectivity, directionselectivity, and luminance responses in RGC terminals. (A) Response profile to luminance changes in AF 4, 5, and 6 presented from the side or below. Pixels are color coded according to the mutually exclusive luminance response types: pixels responsive to increase in luminance (ON), decrease in luminance, and both increase and decrease in luminance (ON-OFF). (B) Representative luminance response in AF4 and 6. Visual stimuli were presented from the side. ROIs correspond to synaptic puncta marked in the right panel. Note that AF5 is not contained in this optical plane. In (A) and (B), functional pixels are plotted on top of the mean image of syGCaMP6s (gray). (C) 3D representation of luminance response in RGC terminals. (Left) 3D model of AFs (as Figure 2B). For side presented 3D map, both AF10 and AF 4, 5, and 6 volumes are pooled from 6 functionally imaged volumes. For underneath presented 3D map, both AF10 and AF 4, 5, and 6 volumes are pooled from 7 functionally imaged volumes. The intensity of pixels corresponds to the frequency of a particular pixel to be luminance responsive across all imaged fish. Note that AF4 and AF9 contain highly luminance responsive RGC terminals and AF5 is weakly ON responsive (right panel). (D) Localization of DS pixels in tectal sublaminae. After registration into the RGC reference brain, DS pixels identified by the side (green) and below (magenta) presentations of visual stimuli were overlaid to the average image of isl2b:Gal4, UAS:syGCaMP6s signals of the same registered volume. DS pixels tuned to forward motion are plotted here for both side and below stimulus presentations. The volume was sliced obliquely to reveal laminar structure along the superficial-deep axis within the tectal neuropil. (E) Intensity plot along region indicated by a box shown in (D). Note that DS pixels for both stimulus positions (side, below) occupy SFGS1. (F, G) Color scheme of orientation space for motion presented from the side (F) and below (G). (H, I) Orientation selectivity (OS) in AF4, AF5 and AF6. The motion was presented from the side (H) and below (I). The color code is shown in (F, G). OS pixels are plotted on top of the mean image of syGCaMP6s (gray). (J) Representative responses of OS-RGC terminals in AF6. Visual stimuli were presented from the side. ROIs correspond to synaptic puncta marked by the two circular ROIs in the bottom left image. Polar plot (bottom right) is derived from the ΔF/F traces shown above. A, anterior; P, posterior; D, dorsal, L, lateral. SO, stratum opticum; SFGS, stratum fibrosum et griseum superficiale; SGC, stratum griseum centrale; SAC, stratum album centrale. Scale bars: 10 μm (A, I), 30 μm (D) and 50 μm (C). |


