
- Title
-
Visualizing Engrafted Human Cancer and Therapy Responses in Immunodeficient Zebrafish
- Authors
- Yan, C., Brunson, D.C., Tang, Q., Do, D., Iftimia, N.A., Moore, J.C., Hayes, M.N., Welker, A.M., Garcia, E.G., Dubash, T.D., Hong, X., Drapkin, B.J., Myers, D.T., Phat, S., Volorio, A., Marvin, D.L., Ligorio, M., Dershowitz, L., McCarthy, K.M., Karabacak, M.N., Fletcher, J.A., Sgroi, D.C., Iafrate, J.A., Maheswaran, S., Dyson, N.J., Haber, D.A., Rawls, J.F., Langenau, D.M.
- Source
- Full text @ Cell

Human Cancers Have Similar Growth Kinetics, Histology, and Rates of Proliferation and Apoptosis when Engrafted into prkdc−/−, il2rga−/− Zebrafish or NSG Mice Human cancers have similar growth kinetics, histology, and rates of proliferation and apoptosis when engrafted into prkdc−/−, il2rga−/− zebrafish or NSG mice. Engraftment of EGFP+ human tumor cells into prkdc−/−, il2rga−/− zebrafish grown at 37°C (A–F) or the same tumors grown in NSG mice for 28 days (G–L). Merged fluorescence and brightfield images of whole zebrafish imaged at 0 and 28 days post transplant (dpt; A) and compared with images of engrafted mice (G, left panels) and excised tumors (G, right panels). Hematoxylin and eosin stained sections (zebrafish, B; mouse, H) and immunohistochemistry for cell lineage markers (zebrafish, C; mouse, I), Ki67 (zebrafish, D; mouse, J) and TUNEL (zebrafish, E; mouse, K) with the average percentage of positive cells ± standard deviation noted (n ≥ 3 animals/tumor type). Quantification of relative tumor growth in engrafted prkdc−/−, il2rga−/− zebrafish (F) and NSG mice (L). Human embryonal rhabdomyosarcoma RD (ERMS RD), alveolar rhabdomyosarcoma Rh41 (ARMS Rh41), melanoma UACC62, and triple-negative breast cancer MDA-MB-231. Scale bars represent 0.25 cm (A); 50 μm (B–E, H–K); and 0.5 cm (G). See also Table S1 and Figure S1. |

Prkdc−/−, il2rga−/− Zebrafish Engraft Patient-Derived Tumors Merged fluorescence and brightfield images of prkdc−/−, il2rga−/− zebrafish imaged at 0 and 28 days post transplant (dpt) (A). Hematoxylin- and eosin-stained sections (B) and immunohistochemistry for Ki67 (C) and TUNEL (D) with the average percentage of positive cells ± standard deviation noted (n ≥ 3 fish/tumor type). Quantification of relative growth of transplanted cells over time (E). Note that Viafluor- and DiL-labeled cells would not be predicted to increase intensity with time, as 100% fluorescence equates to full retention of tumor cells over the experiment. Scale bar represents 0.25 cm (A); 50 μm (B–D). |

Identification of Functionally-Distinct Rhabdomyosarcoma Cell Types Using Photo-Convertible Dendra2-H2b and Single-Cell Fate Mapping (A–E) A prkdc−/−, il2rga−/− zebrafish engrafted with H2b-Dendra2+ RD cells. Cells were engrafted into the peri-ocular muscle and imaged at 7 days post transplantation. Epifluorescent image of head region (A) and higher magnification confocal images (B, 100×; C–E, 200× magnification). Images were taken before 405 nm UV photoconversion (B and C) or immediately post UV exposure (D and E; merged image, E, shows excitation using both 488 and 563 nm laser). (F) Serial imaging of three photo-converted RD ERMS cells. Cells have been pseudo-colored and tracked at 0, 24, 48, 96, and 168 h after photoconversion. Cell fates are pictorially depicted within lower panels with migration denoted by wavy lines. (G) Quantification of single-cell behaviors in RD ERMS and Rh41 ARMS cells. Number of cells imaged with each phenotype are noted within bar graphs. Scale bar represents 0.1 cm (A); 50 μm (B–E); 200 μm (F). See also Figures S2 and S3. |
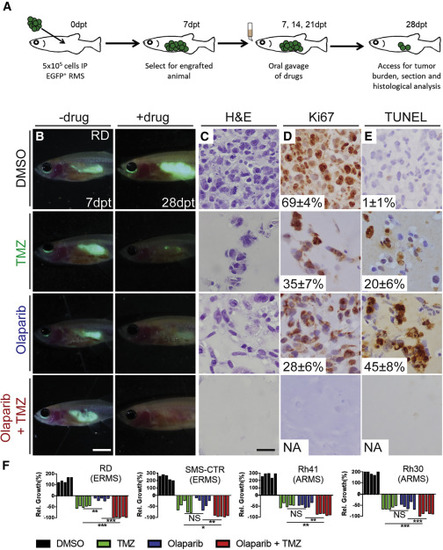
Combination Treatment of Temozolomide and Olaparib PARP Inhibitor Reduces Growth of Human RMS Cells in Engrafted prkdc−/−, il2rga−/− Zebrafish Schematic of experimental design (A). Merged fluorescence and brightfield images of prkdc−/−, il2rga−/− animals engrafted with EGFP+ RD cells (B). Whole-animal imaging of engrafted animal at 7 dpt (prior to drug administration, B, left) and 28 dpt (after three cycles of drug dosing, B, right). Hematoxylin and eosin (C), Ki67 (D), and TUNEL (E) stained sections of fish engrafted with RD RMS cells. The average percentage of positive cells ± standard deviation is noted (n = 5 fish/treatment). Quantification of relative RMS growth after drug administration in RD, SMS-CTR, Rh41, and Rh30 (F) cells. ∗p < 0.05, ∗∗p < 0.01, ∗∗∗p < 0.001, Student’s t test. Not significant (NS). Scale bar represents 0.25 cm (B) and 50 μm (C–E). Not applicable (NA). See also Figure S4. |
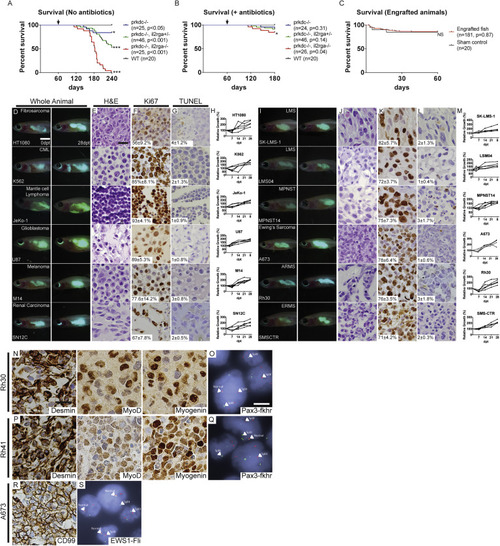
Survival Analysis and Xenograft Engraftment of prkdc−/−, il2rga−/− Zebrafish, Related to Figure 1 Kaplan-Meier survival analysis for prkdc−/−, il2rga−/− zebrafish that were genotyped by scale resection at 60 to 90 days of life and then returned directly to system water without antibiotic treatment and grown at 28.5°C (A) or grown in isolated 4L tanks supplemented with antibiotics and reared at 37°C (B). Kaplan-Meier survival analysis for prkdc−/−, il2rga−/− fish that were injected with sham control or human cancer cells and grown at 37°C in our recirculating system supplemented with antibiotics (C, n = 155 of 181 engrafted animals survived to 60 dpt). ∗p < 0.05 and ∗∗∗p<0.001, log rank test. Not significant (NS). Representative merged fluorescence and brightfield images of EGFP+ human cancers grown in prkdc−/−, il2rga−/− zebrafish (D and I). Images shown at 0 dpt (left, D and I) and 28 dpt (right, D and I), respectively. Hematoxylin- and eosin-stained sections of engrafted tumors (E and J). Ki67 immunohistochemistry (F and K), and TUNEL (G and L) with the average percentage of positive cells ± standard deviation noted (n ≥ 3 fish/tumor type). Quantification of relative growth of EGFP+ human cancer cells successfully engrafted into individual prkdc−/−, il2rga−/− zebrafish (H and M). Tumor type is noted in upper right in leftmost panels (D) and (I) and cell line name in lower left. Chronic myeloid leukemia (CML), leiomyosarcoma (LMS), malignant peripheral nerve sheath tumor (MPNST), embryonal rhabdomyosarcoma (ERMS), and alveolar rhabdomyosarcoma (ARMS). Scale bar represents 0.25 cm (D and I); 50 μm (E–G and J–L). Immunohistochemistry for expression of clinical diagnostic makers and pathognomonic gene fusions in xenografted Rh30 ARMS (N and O), Rh41 ARMS (P and Q), and A673 Ewing’s sarcoma (R and S). Diagnostic fluorescent in situ hybridization (FISH) for FKHR (O and Q) or EWS1 (S). Because probes span the known FKHR or EWS1 genomic breakpoints, split break apart denotes translocation. Scale bars represent 50 μm (N, P, and R) and 5μm (O, Q, and S). |
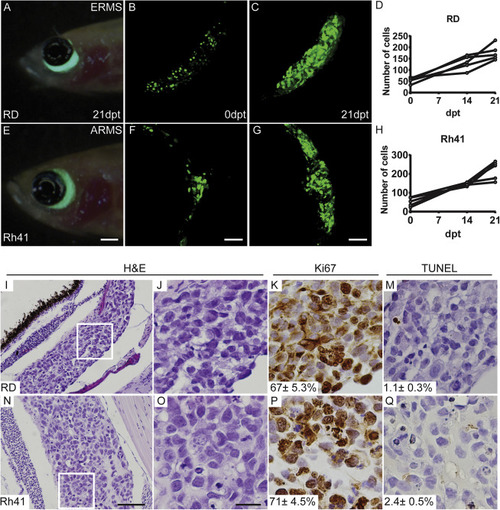
Engraftment of H2b-EGFP+ Rhabdomyosarcoma Cells into the Peri-Ocular Muscle of prkdc−/−, il2rga−/− Zebrafish, Related to Figure 3 (A–H) Live-cell imaging and quantitation of RMS tumor cells over time (RD ERMS: A–D; Rh41 ARMS: E–H). Merged brightfield and fluorescent image of the head region of a prkdc−/−, il2rga−/− zebrafish engrafted with EGFP+ tumor cells for 21 days post-transplantation (dpt; A and E). Serial Z-stack confocal image at 0 dpt (B and F) and 21 dpt (C and G). Quantification of EGFP+ cells over time (D and H). (I–Q) Histological analysis of tumors engrafted into the peri-ocular muscle and analyzed at 21 days post-treatment (RD ERMS: I–M; Rh41 ARMS: N–Q). Hematoxylin and eosin stained sections (I and N, low magnification; and J and O, high magnification of boxed region). Immunohistochemistry for Ki67 (K and P) and TUNEL (M and Q) with average percent positive cells ± standard deviation noted (n ≥ 3 fish/tumor). Scale bar represents 0.1 cm (A and E); 50 μm (B, C, F, and G), 200 μm (I and N); 50 μm (J–M and O–Q). |

Combination Treatment of Temozolomide and Olaparib PARP Inhibitor Reduces Growth of Human Ewing’s Sarcoma and Rhabdomyosarcoma in vivo, Related to Figure 4 Plasma concentration of olaparib (A) or temozolomide (B) when orally gavaged into adult zebrafish (red, n = 25 fish/time point) and compared with previously published mouse (blue) and human studies (green). (C) Merged fluorescence and brightfield images of prkdc−/−, il2rga−/− animals engrafted with EGFP+ A673 Ewing’s sarcoma cells. Animals were imaged at 0 and 7 days post transplant (dpt, prior to drug administration) and at 28 dpt (after three cycles of drug administration). (D) Quantization of relative growth as assessed by fluorescence intensity changes over time. Individual animals are denoted. (E) Waterfall plot showing the same data but depicted by relative growth from day 0 until day 28. ∗∗∗p < 0.001, Student’s t test (n = 5). Not significant (NS). Merged fluorescence and brightfield images of prkdc−/−, il2rga−/− animals engrafted with EGFP+ Rh41 cells (F). Whole-animal imaging of engrafted animal at 0 and 7 dpt (prior to drug administration, F, left) and 28 dpt (after three cycles of drug dosing, F, right). Hematoxylin and eosin (G), Ki67 (H), and TUNEL (I) stained sections of fish engrafted with Rh41 RMS cells (n ≥ 3 animals/treatment). Scale bar represents 0.25 cm (C and F) and 50 μm (G–I). |
Reprinted from Cell, 177(7), Yan, C., Brunson, D.C., Tang, Q., Do, D., Iftimia, N.A., Moore, J.C., Hayes, M.N., Welker, A.M., Garcia, E.G., Dubash, T.D., Hong, X., Drapkin, B.J., Myers, D.T., Phat, S., Volorio, A., Marvin, D.L., Ligorio, M., Dershowitz, L., McCarthy, K.M., Karabacak, M.N., Fletcher, J.A., Sgroi, D.C., Iafrate, J.A., Maheswaran, S., Dyson, N.J., Haber, D.A., Rawls, J.F., Langenau, D.M., Visualizing Engrafted Human Cancer and Therapy Responses in Immunodeficient Zebrafish, 1903-1914.e14, Copyright (2019) with permission from Elsevier. Full text @ Cell