
- Title
-
Lack of Cyclin B1 in zebrafish causes lengthening of G2 and M phases
- Authors
- Petrachkova, T., Wortinger, L.A., Bard, A.J., Singh, J., Warga, R.M., Kane, D.A.
- Source
- Full text @ Dev. Biol.
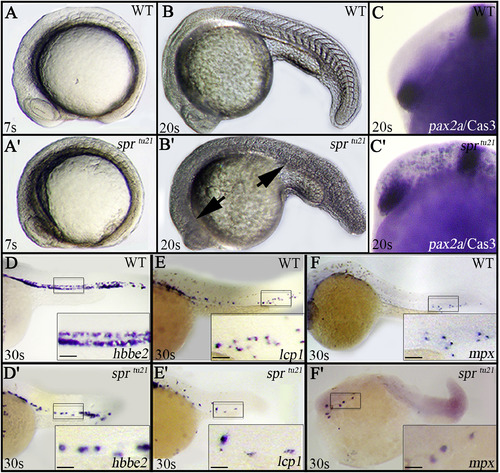
The spr mutant phenotype. (A, B) Morphology of the live embryo, side view of: (A, B) wild-type and (A′, B′) sprtu21 embryos. Arrows indicate darkening in the head and trunk. Note the undefined somiteborders in the mutant by 20-somites (19 h). (C, C′) Apoptosis, visualized by antibody staining for an active form of Caspase 3, is evident in the head of the spr mutant by 25-somites (21.5 h). Embryos are shown in side view using pax2a mRNA expression to define the area between the hindbrain and optic stalk. (D-F′) Blood cells are larger and less frequent in the spr mutant. (D, D′) Labeling of the blood by the erythrocyte marker, hbbe2 (Brownlie et al., 1998), 8/8 mutants and 20/20 wild-type embryos displayed this phenotype; (E, E′) the macrophage marker, lcp1 (Herbomel et al., 1999), 10/10 mutants and 17/17 wild-type embryos displayed this phenotype; (F, F′); and the neutrophil marker, mpx (Bennett et al., 2001; Lieschke et al., 2001), 10/10 mutants and 21/21 wild-type embryos displayed this phenotype. Boxes indicate the areas enlarged at higher magnification, scale bar is 20 μm. EXPRESSION / LABELING:
PHENOTYPE:
|
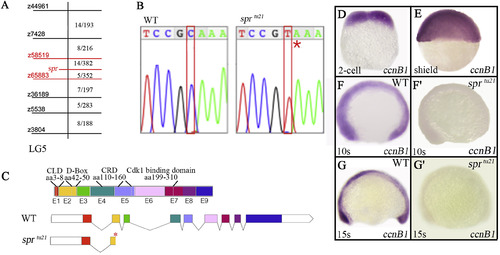
Identification of sprtu21 as a mutation in cyclin B1 gene. (A) A partial genetic map of Linkage Group 5 showing microsatellite (z) markers used in mapping on the left; and the number of recombinants in relation to the total number of individuals on the right. Combined haploid and diploid data show the least number of recombinants between the specter allele and z58519 and z65883, an interval that includes 85 genes (Supplementary Table 1). (B) Chromatograph sequence data showing the C139T transition that results in a premature stop codon (red asterisk). (C) Exon structure of the cyclin B1gene product showing 9 exons (E1-E9) and putative protein coding regions: chromatin localization domain (CLD), destruction box (D-box), cytoplasmic retention domain (CRD), and Cdk1-binding domain. The sprtu21 allele has a premature stop codon in exon 2 (red asterisk). (D-G′) cyclin B1 mRNA is (D, E) maternally, and (F, G) zygotically expressed. (F′-G′) Note that expression of cyclin B1 mRNA in the mutant embryo is significantly diminished at 10-somites (14 h) and absent by 15-somites (16.5 h). EXPRESSION / LABELING:
PHENOTYPE:
|
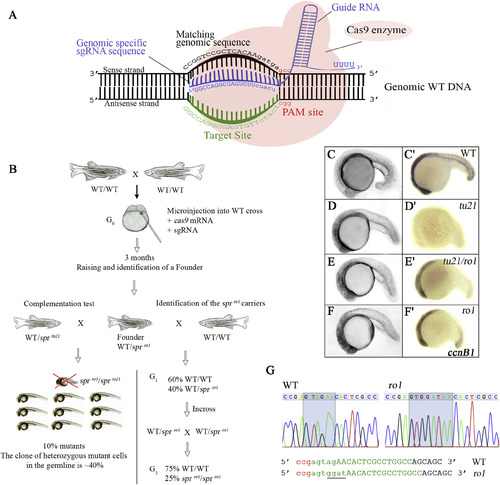
CRISPR/Cas9-mediated mutagenesis confirms sprtu21 is a mutation in the cyclin B1 gene. (A) Schematic representation of the CRISPR/Cas9 system, recognizing the target site within exon 2 of the cyclin B1 gene. Blue, guide RNA (sgRNA); green, target site where ag is the acceptor site of intron 1; red, PAM site. (B) Diagram of CRISPR/Cas9-mediated mutagenesis. Embryos from a wild-type cross (G0) were injected at the 2-cell stage with the cas9 mRNA and sgRNA. After 3 months, founders were complementation tested to sprtu21heterozygotes. In the G1, 10% of the eggs were sprtu21/ro1transheterozygotes suggesting that the germline clone was approximately 40% of the germline. After outcrossing the G1 sprro1founder to wild-type fish, identification of the sprro1 carriers (G2) was done by incrossing. (C–F) In vivo morphology and expression of cyclin B1 mRNA in: (C′) wild-type, (D′) sprtu21, (E′) sprtu21/ro1, and (F′) sprro1mutant embryos at 25 h. All embryos are shown in side view. Note that the sprtu21/ro1 (E′), and sprro1 (F′) mutant embryos have zygotic cyclin B1mRNA transcripts at 20 h, but sprtu21 mutant embryos do not. (G) Chromatograph sequence showing a splice-site mutation occurs in the sprro1. The sprro1 mutant has a 2-base deletion (AG acceptor site) and 4 base insertion (GGAT), underlined. Green, sgRNA target site; red, PAM site. |
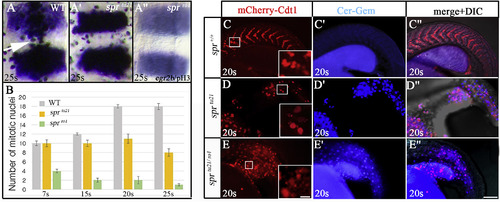
Cyclin B1 mutants have an abnormal cell cycle progression. (A-A″) anti-pH3 staining shows spr mutants have fewer cells in mitosis between the egr2b stripes in rhombomeres 3 and 5, dorsal view. Mitotic cells align at the dorsal midline (white arrow) in the wild-type embryo (A), but do not in the sprtu21 mutant (A′) whose mitotic cells are irregularly shaped. In the sprro1 mutant (A″), pH3 staining is weak and reveals few mitotic cells. (B) Quantification of the number of mitotic cells between the egr2b stripes in the wild-type embryos (grey), sprtu21mutant (yellow), and sprro1 mutant (green) between 7- and 25-somites (12 h and 21.5 h). Starting at 15-somites (16.5 h), the number of mitotic cells in the sprtu21 allele is significantly fewer (p < 0.05) compared to wild-type embryos. The counts for the sprro1 allele are statistically significant compared to both, wild-type and sprtu21 at all stages (p < 0.01). (C-E″) The Dual FUCCI transgene shows that cells in the sprmutant reside in the wrong phase of the cell cycle at 20-somites. Shown are populations of cells in the tail where the cell cycle reporter mCherry-Cdt1 (red) defines cells in G1 (G0) stage (C–E) and the Cerulean-Geminin (blue) defines cells in S/G2/early M stages (C′-D″). Whereas the majority of cells in wild-type embryos are in the G1 (G0) stage of cell cycle (C-C″), the majority of cells in sprtu21 (D-D″) and sprtu21/ro1 (E-E″) mutants are in the S/G2/early M phase of the cell cycle. Scale bar is 100 μm. Inserts show that G1 (G0) cells have abnormal shapes in mutant embryos, scale bar is 10 μm. PHENOTYPE:
|
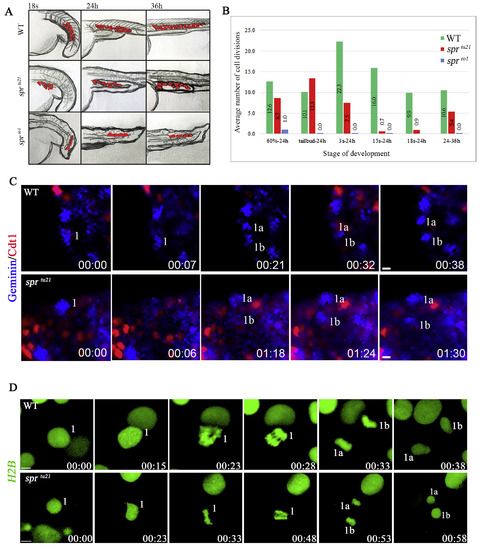
Cell division does not completely stop in spr mutants; however, each allele has a unique phenotype. (A) Illustration of lineage tracing analysis for EVL cells in wild-type and mutant embryos. (B) Average number of cell divisions in a clone between the time marked and 24 h or 36 h. Each point is based on 3 or more clones. After tailbud, EVL cells cease to divide in the sprro1 mutant. (C) Frames from a time-lapse recording, showing cell divisions still occur at 24 h in the EVL of wild-type embryos (top panel) and sprtu21 mutants (bottom panel). The Dual FUCCI transgene reports cells in the S/G2/early M phase of the cell cycle (blue) or in the G1 (G0) phase of cell cycle (red). Wild-type cells take approximately 20 minutes to go from metaphase to the next S-phase; whereas mutants take about 1 hour. Scale bar is 10 μm. (D) Frames from a time-lapse recording, showing that deep cells continue to divide at 5-somites (11.5 h) in wild-type embryos (top panel) and sprro1 mutants (bottom panel) using H2B-RFP mRNA (pseudo colored in green) shows that wild-type cells take approximately 15 minutes to get through mitosis, whereas mutants take about 35 minutes. Scale bar is 5 μm. PHENOTYPE:
|
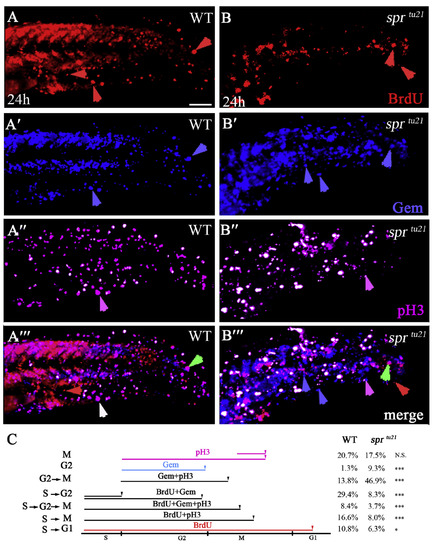
sprtu21 mutant cells spend longer time in G2 and M phases. (A-B‴) The same cells in wild type (A-A‴) and mutant (B-B‴) visualized with different markers to distinguish between the stages of the cell cycle at 24 h. Embryos were labeled for 1 hour with BrdU and then fixed and stained for: anti-BrdU to visualize cells in the S-phase (A, B); anti-GFP to visualize Cerulean-Geminin cells in S/G2/early M phase (A′-B′); and anti-pH3 antibody to visualize cells in mitosis (A″, B″); or the merge (A‴, B‴). Symbols are: red arrows, cells that have gone through a full cell cycle and reside in G1 phase; green arrows, cells that have entered S phase; white arrows, cells that have gone through the S phase and entered mitosis; pink arrows, cells that have entered M phase but did not go through S phase; blue arrows, cells that have entered in the G2/early M phase. Scare bar is 50 μm. (C) Quantification of cells in a specific phase of the cell cycle from the data above. PHENOTYPE:
|
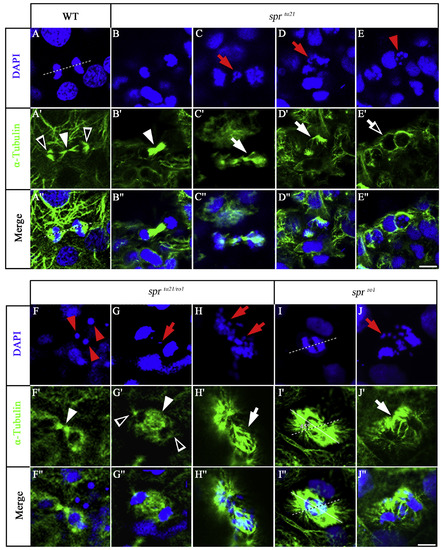
spr mutants show signs of chromosome instability. DAPIstaining and anti-alphaTubulin staining in the wild-type embryo (A-A″), the sprtu21 mutant (B-E″), sprtu21/ro1 transheterozygote (F-H″), and the sprro1 mutant (I-J″) at 24 h. Symbols are: red arrows, chromosome separation defects; red arrowheads, pyknotic nuclei suggestive of cell death; white arrowheads, polar microtubules; open white arrowheads, astral microtubules; open white arrows, apoptotic microtubules; white arrows, abnormal spindle microtubule organization; dashed line, expected spindle orientation; solid line, observed spindle orientation. Scale bar is 10 μm. PHENOTYPE:
|
Reprinted from Developmental Biology, 451(2), Petrachkova, T., Wortinger, L.A., Bard, A.J., Singh, J., Warga, R.M., Kane, D.A., Lack of Cyclin B1 in zebrafish causes lengthening of G2 and M phases, 167-179, Copyright (2019) with permission from Elsevier. Full text @ Dev. Biol.