
- Title
-
Establishment of a zebrafish hematological disease model induced by 1,4-benzoquinone
- Authors
- Zhang, A., Wu, M., Tan, J., Yu, N., Xu, M., Yu, X., Liu, W., Zhang, Y.
- Source
- Full text @ Dis. Model. Mech.

Kaplan–Meier survival curve and analysis of zebrafish embryo phenotype following exposure to 1,4-benzoquinone (BQ). (A) Survival rates in zebrafish embryos following continuous exposure to BQ (n=278 per group) in the range 8–10 μM, from 2 dpf to 9 dpf (log-rank test, P<0.001). (B) Phenotypic traits (indicated by the arrows in C) observed following BQ exposure (Chi-squared test, mean±s.d., *P<0.05, **P<0.01). (C) Typical malformations were observed in zebrafish embryos exposed to BQ. Scale bars: 500 μm. |

Expression of lineage-specific markers in zebrafish was detected using WISH and SB staining. (A,B) Loss of βe1-globin (n=20) and rag1(control group n=37, BQ group n=49) expression in 5 dpf embryos exposed to BQ. The red boxed regions show magnified views of the caudal hematopoietic tissue (CHT). Relative rag1+ thymocyte-signal areas were analyzed using ImageJ software. The circled regions show the thymus. (C) Increase in l-plastin expression upon BQ exposure at 3 dpf (control group n=25, BQ group n=30). (D) Expression of the macrophage marker mfap4 was reduced in the BQ exposure group (control group n=52, BQ group n=76). (E,G) The neutrophil markers mpx (E) (control group n=20, BQ group n=33) and lyz (G) (control group n=39, BQ group n=35) both showed increased expression in embryos at 3 dpf following BQ exposure. (F) Increased SB+ cells were observed in the BQ exposure group compared with the control group (n=21 per group). (H–N) Quantification of WISH and SB staining for A–E (Student's t-test, mean±s.d., **P<0.01, ***P<0.001). (O) Dot plot of flow cytometry analysis of lyz:GFP+ cells from control (left) and BQ-treated fish (right). Three independent experiments (in each group, 100 embryos are pooled together) were conducted. (P) Percentage of lyz+ cells in each group [0.30% in the control group and 0.40% in the BQ group; Chi-squared test (95% c.i.), ***P<0.001]. EXPRESSION / LABELING:
PHENOTYPE:
|

Exposure to BQ induced neutrophil proliferation in zebrafish embryos.(A,B) BrdU incorporation assay. Double staining of BrdU/lyz (A) showed BrdU incorporation of CHT lyz+ cells in BQ-exposed embryos and controls at 3 dpf. Arrows indicate lyz/BrdU double-positive cells. Scale bars: 50 μm. Percentage of the CHT-localized lyz+ myeloid cells that incorporate BrdU (B) in lyz+ myeloid cells (Student's t-test, control group n=30, BQ group n=26, mean±s.d., **P<0.01). EXPRESSION / LABELING:
PHENOTYPE:
|
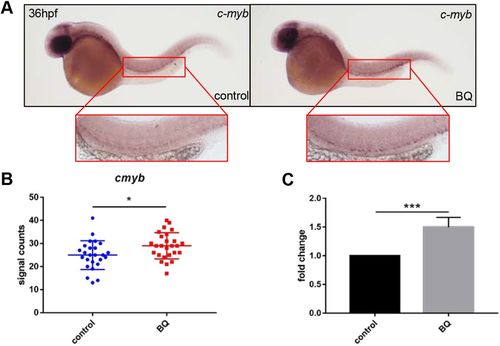
Effect of BQ exposure on c-myb expression. (A–C) BQ exposure increased c-myb expression. Both WISH performed at 36 hpf (A,B) and RT-qPCR performed at 2 dpf (C) indicated increased expression of c-myb in BQ-exposed (right, A) and control (left, A) groups (Student's t-test, n=25 or 26, mean±s.d., *P<0.05, ***P<0.001). The red boxed regions show magnified views of the aorta-gonad-mesonephros (AGM). |
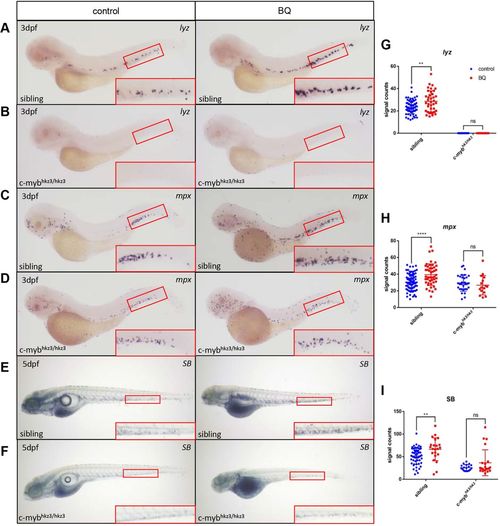
BQ-induced neutrophil expansion was blocked in c-myb-deficient mutants. (A–I) Expression of the neutrophil markers lyz (A,B) (sibling control group n=65, BQ group n=38; mutant control group n=25, BQ group n=35) and mpx (C,D) (sibling control group n=83, BQ group n=47; mutant control group n=31, BQ group n=16) was analyzed using WISH, and SB staining (E,F) (sibling control group n=54, BQ group n=18; mutant control group n=25, BQ group n=22) was detected, in c-mybhkz3/+ intercrossed progenies in BQ-treated groups (right column) and untreated controls (left column). Signals increased following BQ exposure at 3 dpf in siblings (A,C,E) but were unaltered in c-mybhkz3/hkz3 mutants (B,D,F). The red boxed regions show magnified views of the CHT. (G–I) Quantification of WISH and SB staining for panels A–F (Student's t-test, mean±s.d., **P<0.01, ****P<0.0001; ns, non-significant). EXPRESSION / LABELING:
PHENOTYPE:
|
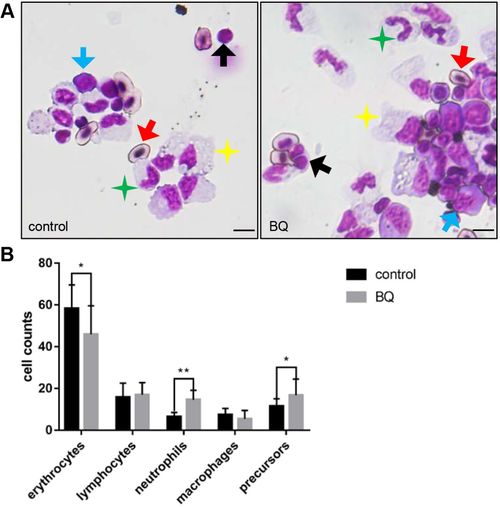
BQ hematotoxicity to adult fish. (A) May–Grunwald/Giemsa of KM cells in BQ-exposed (right) and control (left) fish. Red arrows, erythrocytes (oval-shaped nucleus and cytoplasm); black arrows, lymphocytes (large round-shaped nucleus surrounded by minimal cytoplasm); green stars, neutrophils (segmented nucleus and cytoplasm with distinct neutral granules); yellow stars, macrophages (large irregular-shaped cytoplasm with distinct vacuoles); blue arrows, precursors (large and dense nucleus with dark cytoplasm). Scale bars: 5 μm. (B) Blood cell counts of KM in each group were calculated manually based on their morphology (Student's t-test, n=9, mean±s.d., *P<0.05, **P<0.01). PHENOTYPE:
|