
- Title
-
Imaging mechanical properties of sub-micron ECM in live zebrafish using Brillouin microscopy
- Authors
- Bevilacqua, C., Sánchez-Iranzo, H., Richter, D., Diz-Muñoz, A., Prevedel, R.
- Source
- Full text @ Biomed. Opt. Express

Characterization of the zebrafish notochord at 3 days post fertilization (dpf). (A) Schematic of the zebrafish tail at 3 dpf. Lateral (top) and transverse (bottom) views. (B) Bright field with overlapping fluorescence of a Tg(col9a2:GFPCaaX) zebrafish embryo at 3 dpf with GFP fluorescence from sheath cells. (C-D) Maximum intensity projection of the notochord in triple transgenic Tg(col9a2:GFPCaaX); SAGFF214A; Tg(UAS-E1b:NfsB-mCherry) zebrafish embryo at 3 dpf. Sheath cells (C) or simultaneously sheath and vacuolated cells (D) can be observed. Scale bars, 500 μm in (B), 20 μm in (C and D). ECM, extracellular matrix. |
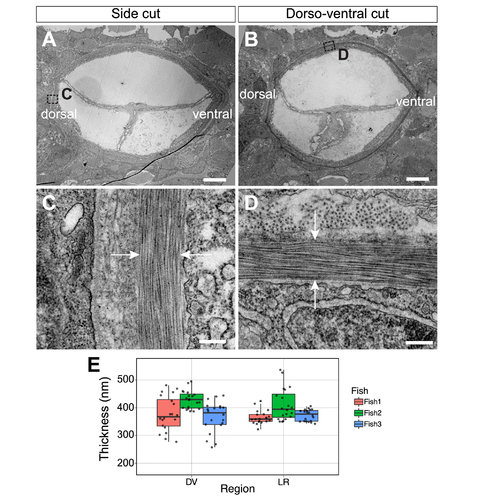
(A-B) Low magnification TEM of transverse notochord after side (A) and dorso-ventral (B) cuts of a Tg(col9a2:GFPCaaX) zebrafish embryo at 3 dpf and ~200-250 µm anterior from the posterior end of the notochord. (C-D) High magnification TEM of transverse view ECM (between white arrows) after side (C) and dorso-ventral (D) cuts. (E) Quantification of ECM thickness in left-right (LR) and dorso-ventral (DV) regions of 3 embryos. Scale bars, 5 μm in (A and B) and 250 nm in (C and D). |
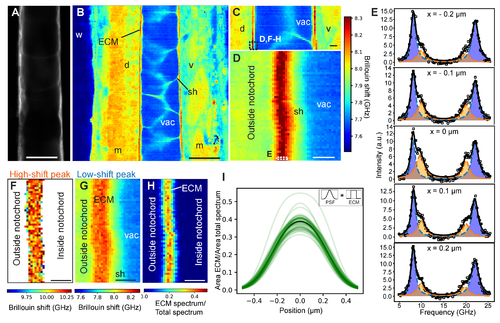
High-resolution mechanical imaging of zebrafish notochord ECM in-vivo. Brillouin shift maps were acquired in the middle between the left-right animal’s side (posterior, top; anterior, bottom). (A) Confocal image of sheath cells (GFP) as well as corresponding coarse-grained overview Brillouin image in (B) recorded with 1 µm step size at 3 days post fertilization (dpf) centred ~500 µm anterior from the posterior end of the notochord. (C) Brillouin shift map at 3 dpf centred ~250 µm from the posterior end (1 µm step size). (D) High-resolution Brillouin map of boxed area denoted in (C) with a step size of 0.1 µm. (E) Brillouin spectra recorded at discrete positions across the ECM (boxed area in (D)). Double-peak fitting distinguishes two Brillouin shifts of the ECM (orange and blue). Here, the fitting parameters were seeded from the parameters obtained from the fit to the pixel with highest ECM peak contribution and then subsequently constraining the ECM peak around ± 0.7 GHz when analyzing the surrounding pixels in order to prevent artefacts. We note that the observed variability in ECM peak shift is much lower than this fitting constraint. Brillouin shift map for the “high-shift” peak (F) and for the “low-shift” peak (G) – here pixels without a second peak are removed. A spatial map of the ratio of the spectral contributions is plotted in (H). (I) Line plots of ECM contribution to total spectrum across the ECM in (H), centred by their respective maximum. The represented curves are the result of the fitting with the convolution of the measured PSF (Gaussian) and ECM (box function - as shown in the inset). Black line denotes average of individual line plots. Brillouin images were obtained with a 0.85 NA objective and using 8.3 mW of laser power and 0.25 s of exposure time per pixel. w, water; m, muscle; sh, sheath cell; vac, vacuole; ECM, extracellular matrix; d, dorsal; v, ventral. Scale bars, 20 μm in (A,B), 5 μm in (C), 1 μm in (D,F,G,H). |
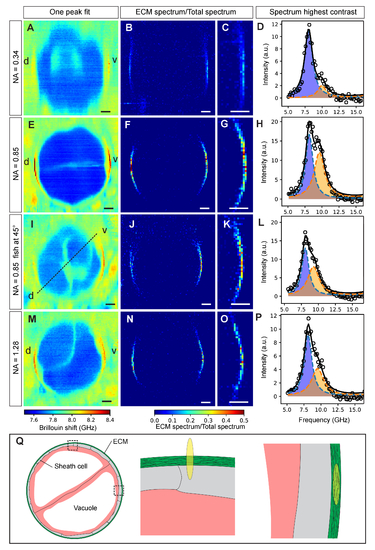
Axial cross-section of zebrafish notochord mechanics. The effect of objective NA on the Brillouin map and contrast of the ECM is shown for low (0.34), medium (0.85), medium (0.85) of 45-degree rotated sample and high (1.28) effective NA in A-D, E-H, I-L and M-P respectively. In traditional single-peak fit Brillouin shift maps the ECM displays poor visibility (A,E,I,M). Dual-peak analysis and plotting the spectral ratios does improve contrast (B,F,J,N). (C,G,K,O) Zoom-ins. (D,H,L,P) Spectra of pixels with the highest contrast in (C,G,K,O), respectively. (Q) Illustration showing the cross-section of the notochord (left) as well as the overlap of the PSF with the ECM when measuring on the lateral (middle) and dorso-ventral (right) side, respectively. Brillouin images were obtained using 8.3 mW of laser power and 0.25 s of exposure time per pixel. Step size: 0.5 µm. d, dorsal; v, ventral. Scale bars, 10 µm. |