FIGURE SUMMARY
Title

Midbrain tectal stem cells display diverse regenerative capacities in zebrafish

Authors
Lindsey, B.W., Aitken, G.E., Tang, J.K., Khabooshan, M., Douek, A.M., Vandestadt, C., Kaslin, J.
Source
Full text @ Sci. Rep.

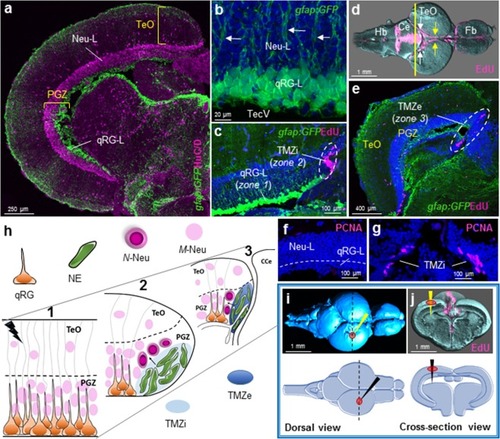
Tectal composition, stem cell niches, and stab lesion model. (a) Cross-sectional view of a single adult tectal hemisphere showing a laminar composition consisting of outer tectal superficial layers (TeO) and the deeper, cell-dense, periventricular grey zone (PGZ). The PGZ is subdivided into an upper neuronal layer (Neu-L, cytoplasmic HuC/D labelling; pink) and a quiescent radial-glial layer (qRG-L; Tg(gfap:GFP)mi2001 labelling; green) populating the roof of the tectal ventricle. (b) High magnification of the PGZ illustrating the 3–4 cell deep structure of the qRG-L (green) abutting the tectal ventricle (TecV) with radial processes extending upwards from qRG cells through the Neu-L (white arrows) and towards the superficial tectal layers. (c) Neuro-epithelial-like amplifying progenitor cells (NE; pink; zone 2) identified by EdU-labelling are located at the internal tectal marginal zone (TMZi; white dashed circle), adjacent to the qRG-L (green; zone 1). (d) Dorsal view of the homeostatic staining pattern of cell proliferation using EdU (pink) in reconstructed whole brains following Optical Projection Tomography (OPT). Image shows constitutively proliferating NE cells extending the length of the tectum from the TMZi where amplifying NE progenitor cells reside (yellow arrows), to the external tectal marginal zone (TMZe; white arrows) where more slowly proliferating NE cells have been identified48,49. Hb, hindbrain; Ce, cerebellum; TeO, optic tectum; Fb, forebrain. Yellow line depicts cross-sectional level shown in panel (e). (e) Cross-section view of the TMZe (white dashed circle; zone 3) labelled with EdU (pink), where populations of slow cycling NE exist at the posterior aspect of the adult midbrain adjacent to the medially located cerebellum. (f,g) Proliferating Cell Nuclear Antigen (PCNA) immunolabelling confirming the same constitutive pattern of cell division seen with EdU (compare with panel c) in the qRG-L and TMZi. (h) Schematic representing the three stem cell zones (1–3) investigated following tectal stab lesion (lightning bolt) superficial to the underlying qRG layer: 1 – qRG population (orange) lining the tectal ventricle; 2 – proliferating NE amplifying progenitors (green) located at the TMZi (light blue) adjacent the qRG population; 3 – slowly cycling NE cells located in the caudal TMZe (dark blue). Note that NE cells of zones 2–3 proliferate under homeostatic conditions, with zone 2 NE amplifying progenitors producing lifelong newborn neurons (N-Neu). M-Neu, mature neuron; CCe, corpus cerebelli. (i,j) Dorsal (i) and cross-sectional (j) views of the intact control brain depicting the neuroanatomical level (i, black dashed line) and cannula insertion site (red circles; black and yellow arrows) for our tectal stab lesion into the left hemisphere in OPT reconstructed brains (top) and schematic images (bottom). In panels b,c,e–g, DAPI nuclear counterstaining (blue) was performed. In panels c–g, EdU was pulsed twice over a 4-hr chase period prior to sacrifice. In all cross-sectional and whole brain images dorsal is oriented up.

Histological response following tectal lesion. (a) Experimental design for hematoxylin and eosin (H&E) staining following lesion. (b) Control tectum showing well organized PGZ and highly vascularized superficial TeO layers (yellow arrowheads). (c,d) Overview of the tectal response to stab lesion in the lesioned (c) and unlesioned (d) hemispheres at 1-dpl. At low magnification most conspicuous is the blood pooling immediately below the lesion site and the highly disrupted TeO and PGZ compared to the unlesioned hemisphere. Higher magnification views are demarcated by black boxes for lesioned (e) and unlesioned (e’) hemispheres. (e-e’) Tissue 1-dpl in the lesioned hemisphere (e) showed extensive damage across tectal layers (TeO + PGZ) following cannula insertion, the presence of vacuoles at the lesion site (black arrowheads), and extensive blood pooling underlying the fragmented PGZ (yellow arrows). Despite a slight disruption in the PGZ, the unlesioned hemisphere (e’) closely resembles uninjured control tissue (b). (f-f’) Tissue at 3-dpl in the lesioned hemisphere (f) was characterized by a reduction in the size of vacuoles and oedema, along with a pronounced increase in the number of cell bodies within the lesion canal (yellow arrows). However, already at 3-dpl the PGZ begins to resembled the unlesioned hemisphere. The unlesioned hemisphere (f’) appeared similar to 1-dpl (e’). (g-g’) Tissue at 7-dpl in the lesioned hemisphere (g) demonstrated a reduction in the number of cell bodies from within the lesioned canal, but showed that both sides of the canal have yet to re-joined together (yellow arrows). No change in the unlesioned hemisphere from 3-dpl was noted (g’). (h-h’) While complete tissue recovery was not achieved by 3-mpl in the lesioned hemisphere (h), tissue had re-joined together and both the superficial TeO layers and PGZ closely resembled control conditions. At 3-mpl, the unlesioned hemisphere was indistinguishable from the uninjured control (b). Cross-sectional views with dorsal oriented up are shown for all histological images. In (e–h), green asterisks denote the site of lesion. dpl, days post lesion; mpl, months post lesion.

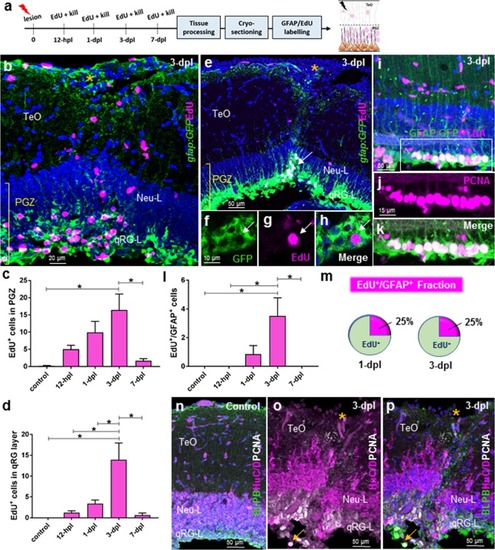
Cell proliferation post-lesion in the qRG layer of the periventricular grey zone (PGZ; stem cell zone 1). (a) Experimental design to investigate EdU proliferation arising from the qRG populations. (b) Example of the proliferative response at the lesion site (orange asterisk) in the PGZ (high proliferation) and superficial layers (modest proliferation) at 3-dpl when response is maximal. (c) Total EdU+ cells in the PGZ (Neu-L + qRG-L) at times post-lesion. One-way ANOVA; F (4, 23) = 4.395, p = 0.0087; Tukey’s multiple comparisons test: 3-dpl vs control, p = 0.0109; 3-dpl vs 7-dpl, p = 0.0365. (d) Total EdU+ cells in the qRG layer at times post-lesion. One-way ANOVA; F (4, 24) = 8.585, p = 0.0002; Tukey’s multiple comparisons test: 3-dpl vs control, p = 0.0005; 3-dpl vs 12-hpl, p = 0.0008; 3-dpl vs. 1-dpl, p = 0.0031; 3-dpl vs 7-dpl, p = 0.0018. (e) Example of a population of co-labelled gfap:GFP+/EdU+ cells in the qRG layer of the PGZ at 3-dpl (qRG-L, white arrow). High magnification view of proliferating radial-glia (pRG) in separate GFP (f) and EdU (g) channels, and merge (h) at 3-dpl. (i–k) Co-labelled population of gfap:GFP+/PCNA+ pRG lining the tectal ventricle at 3-dpl. White box in (i) denotes images shown in (j and k). (l) Total EdU+/GFAP+ proliferating radial-glial (pRG) cells arising from activated qRG at times post-lesion. One-way ANOVA; F (4, 22) = 4.479, p = 0.0085; Tukey’s multiple comparisons test: 3-dpl vs control, p = 0.0308; 3-dpl vs 12-hpl, p = 0.0133; 3-dpl vs. 1-dpl, p = 0.0707; 3-dpl vs 7-dpl, p = 0.0308. (m) Fraction of EdU+/GFAP+ cells as a percentage of the total EdU+ population in the PGZ at 1-dpl and 3-dpl. (n,o) Double-labelling of PCNA with the pan-neuronal marker HuC/D demonstrating an absence of PCNA+/HuC/D+ cells under control condition (n) and at 3-dpl (o,p) in the densely populated neuronal layer (Neu-L). Co-labelling of PCNA and basic lipid binding protein (BLBP) can be observed as previous in the qRG-layer (qRG-L; yellow arrow). Experimental replicates were combined for all statistical analyses. All data presented are mean ± S.E.M. Significance was accepted at p < 0.05 and is denoted by an asterisk. In panels b,e,h,i,n,p DAPI nuclear counterstaining (blue) was performed. In all cross-sectional images dorsal is oriented up. hpl, hours post lesion; dpl, days post lesion.

Cell proliferation post-lesion in the TMZi (stem cell zone 2) and TMZe (stem cell zone 3). (a) Experimental design to investigate EdU proliferation by NE progenitors of the TMZi and TMZe. (b,c) Examples of the EdU+ population size of NE amplifying progenitors (pink EdU) in the TMZi observed in the lesioned (yellow asterisk; solid white circle) and unlesioned (dashed white circle) hemispheres at 1-dpl (b), and 3-dpl (c). (d) Number of EdU+ NE cells in the TMZi of lesioned hemispheres at times post-injury compared with control (uninjured animal) levels (one-way ANOVA, F (3, 18) = 7.686, p = 0.0016; Tukey’s multiple comparisons test: control vs 3-dpl, p = 0.005; significance denoted by#), and between lesioned and unlesioned hemispheres at each time point (unpaired t-test, two-tailed: 1-dpl lesioned vs 1-dpl unlesioned, p = 0.0061; 3-dpl lesioned vs 3-dpl unlesioned, p = 0.0096; significance denoted by *). (e,f) Examples of EdU+ labelling (pink) of NE cells in the TMZe of the posterior tectum (white dashed circles) at 3-dpl between the lesioned and unlesioned hemispheres. (g) Quantification of the number of EdU+ cells between the lesioned and unlesioned hemispheres in the TMZe (unpaired t-test, two-tailed: p = 0.9211). Experimental replicates were combined for all statistical analyses. All data presented are mean ± S.E.M. Significance was accepted at p < 0.05 and is denoted by an asterisk unless stated otherwise. In panels b,c,e,f DAPI nuclear counterstaining (blue) was performed. In all cross-sectional images dorsal is oriented up. TMZi, internal tectal marginal zone; TMZe, external tectal marginal zone; hpl, hours post lesion; dpl, days post lesion.

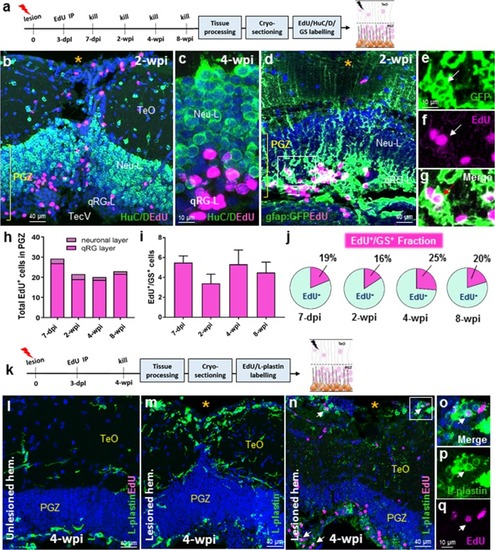
Differentiation post-lesion in activated qRG of the qRG-layer. (a) Experimental design to study differentiation of proliferating radial-glia (pRG) at chase periods post-EdU injection. (b,c) Low and high magnification examples displaying the absence of co-labelling of EdU+ cells (pink) in the PGZ with the neuronal marker, HuC/D (green) at 2-wpi (b) and 4-wpi (c). (dg) Representative images of co-labelling of EdU+/gfap:GFP+ cells in the qRG layer (qRG-L) of the PGZ at 2-wpi. White box in (d) shown at higher magnification and in separate channels confirming co-labelling of pRG with EdU (eg; white arrows). (h) Total EdU+ cells in the upper neuronal layer and deeper qRG layer at consecutive chase periods (one-way ANOVA; F (3, 35) = 2.239, p = 0.1009; Tukey’s multiple comparisons test: 7-dpi vs 2-wpi, p = 0.2082; 7-dpi vs 4-wpi, p = 0.1072; 7-dpi vs 8 wpi, p = 0.3333; 2-wpi vs 4-wpi, p = 0.9863; 2-wpi vs 8-wpi, p = 0.9984; 4-wpi vs 8-wpi, p = 0.9621). Standard error of the mean for total EdU+ cells (neuronal layer + qRG layer): 7-dpi ± 2.4; 2-wpi ± 2.9; 4-wpi ± 2.7; 8-wpi ± 3.5. (i) Quantification of EdU+/GS+ cells at increasingly longer chase periods post tectal lesion in the qRG layer (one-way ANOVA; F (3, 17) = 0.7972, p = 0.5123; Tukey’s multiple comparisons test: 7-dpi vs 2-wpi, p = 0.5190; 7-dpi vs 4-wpi, p = 0.9994; 7-dpi vs 8- wpi, p = 0.9232; 2-wpi vs 4-wpi, p = 0.5845; 2-wpi vs 8-wpi, p = 0.9107; 4-wpi vs 8-wpi, p = 0.9533). (j) Fraction of EdU+/GS+ cells as a percentage of the total EdU+ population in the PGZ at four chase periods examined. (k) Experimental design to examine the contribution of macrophages, using the L-plastin antibody (green), to cell proliferation at the site of injury at 4-wpi. (l) The unlesioned hemisphere displays a small number of non-proliferative resident microglia in the TeO and PGZ. (m) A large population of amoeboid-like macrophages are observed in the TeO surrounding the tectal lesion site, with L-plastin staining in the PGZ resembling the unlesioned condition. Co-labelling with EdU (pink) reveals a population of L-plastin+ cells that are in a proliferative state (white arrows). White box is shown in higher magnification in panels o,p. (o,p) Merge and single channels showing a representative L-plastin+/EdU+ cell (white arrow) adjacent the lesion site at 4-wpi. Experimental replicates were combined for all statistical analyses. All data presented are mean ± S.E.M. Significance was accepted at *p < 0.05. Orange asterisk (*) denotes the lesion site in (b,d,m,n). In panels b–d, l–o, DAPI nuclear counterstaining (blue) was performed. In all cross-sectional images dorsal is oriented up. dpl, days post lesion; dpi, days post EdU injection; wpi, weeks post EdU injection.

Differentiation post-lesion in NE amplifying progenitors in the TMZi. (a) Experimental design to investigate the time course of differentiation of NE amplifying progenitors to newborn neurons at 7-dpi and 2-wpi. (b) Image displaying the tectal midline showing the TMZi of lesioned (yellow asterisk; white dashed circle) and unlesioned (solid circle) hemispheres at 7-dpi. (c,d) High magnification examples showing co-labelling of EdU+/HuC/D+ cells adjacent the TMZi at 2-wpi. (e) Number of EdU+/HuC/D+ cells between the lesioned and unlesioned hemispheres at 7-dpi and 2-wpi of EdU (unpaired t-test, two-tailed: 7-dpi lesion vs 7-dpi unlesioned, p = 0.0083; 2-wpi lesion vs 2-wpi unlesioned, p = 0.0336). (f) Fraction of EdU+/HuC/D+ cells as a percentage of the total EdU+ population in the PGZ across chase times post-lesion. Experimental replicates were combined for all statistical analyses. All data presented are mean ± S.E.M. Significance was accepted at *p < 0.05. In panels b-d, DAPI nuclear counterstaining (blue) was performed. In all cross-sectional images dorsal is oriented up. TMZi, internal tectal marginal zone; dpl, days post lesion; dpi, days post EdU injection; wpi, weeks post EdU injection.

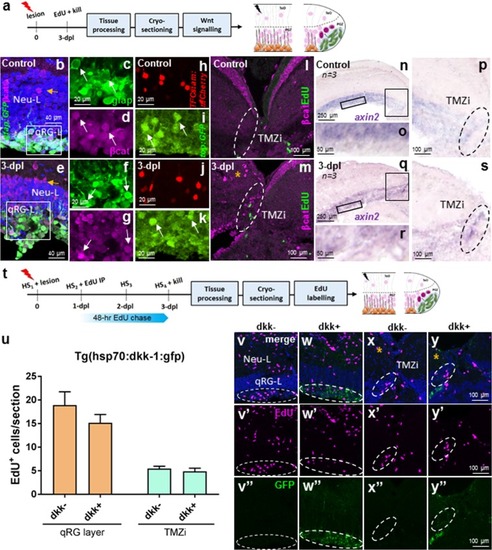
Wnt/β-catenin signalling in stem cell zone 1 (qRG-L) and zone 2 (TMZi) following tectal lesion. (a) Experimental design to study Wnt/β-catenin signalling at 3-dpl. (b–d) Physiological levels of β-catenin expression in the neural layer (Neu-L) and qRG layer (qRG-L; stem cell zone 1). A small number of β-catenin-positive neuronal cell bodies are seen in the Neu-L (yellow arrow). White box depicts higher magnification images of the qRG-L in (c,d). Split-channel images showing co-labelling of qRG (c) and β-catenin (d; white arrows). (eg) Lesion-induced β-catenin staining in the neural layer (Neu-L) and qRG layer (qRG-L) showing upregulation in the proportion of neuronal cells expressing nuclear β-catenin. White box depicts higher magnification images of the qRG-L in (f,g). Split-channel images showing co-labelling of qRG (f) and β-catenin (g; white arrow). (hk) Common expression pattern of Wnt activity observed in the qRG-L between control (h,i) and at 3-dpl (j,k) using the Wnt reporter lines Tg(TCFSiam:mCherry) and Tg(top:GFP; white arrows). (l,m) β-catenin expression and EdU-labelling at the TMZi (stem cell zone 2; dashed white circles) under control conditions (l) and at 3-dpl (m, orange asterisk), showing increased nuclear expression in putative neurons post-lesion. (np) Homeostatic levels of axin2 expression in the qRG layer (o) and TMZi (p; black dashed circle). Black boxes in (n) denote higher magnifications in (o,p). (q,s)axin2 expression 3-dpl in the qRG layer (r) and TMZi (s; black dashed circle). Black boxes in (q) denote higher magnifications in (r,s). (t) Experimental design to study the requirement of Wnt/β-catenin signalling for the proliferative response of stem cells to tectal stab lesion using the heat-shock line Tg(hsp70l:dkk-1:gfp). (u) EdU population size in the qRG layer and TMZi shows no change in proliferation post-injury in the absence of Wnt signalling (dkk+) compared with wildtype animals (dkk-) using the Tg(hsp70:dkk-1:gfp) transgenic line (unpaired t-test, two-tailed: qRG layer, p = 0.3081; NE-Ap zone, p = 0.4960). (v-w”) Representative images of EdU+ staining (pink) in the qRG layer (dashed lines) in dkk- (control; v-v”) and dkk + (w-w) post-lesion. (x-y”) Representative images of EdU+ staining (pink) in the TMZi (dashed lines) in dkk- (control; x-x) and dkk + (y-y) post-lesion. Orange asterisk denotes the lesioned hemisphere. Note GFP+ expression observed in the dkk + (w”,y”) but not dkk- (v”,x”). Experimental replicates were combined for all statistical analyses. All data presented are mean ± S.E.M. Significance was accepted at *p < 0.05. In panels b,e, v–y, DAPI nuclear counterstaining (blue) was performed. In all cross-sectional images dorsal is oriented up. TMZi, internal tectal marginal zone; dpl, days post lesion.

Acknowledgments
This image is the copyrighted work of the attributed author or publisher, and ZFIN has permission only to display this image to its users. Additional permissions should be obtained from the applicable author or publisher of the image. Full text @ Sci. Rep.