
- Title
-
Zebrafish model of amyloid light chain cardiotoxicity: regeneration vs degeneration
- Authors
- Mishra, S., Joshi, S., Ward, J.E., Buys, E.P., Mishra, D., Mishra, D., Morgado, I., Fisch, S., Lavatelli, F., Merlini, G., Dorbala, S., MacRae, C.A., Liao, R.
- Source
- Full text @ Am. J. Physiol. Heart Circ. Physiol.

Human LC protein is expressed in the liver and secreted into circulation. The human λ LC protein was detected in the liver of transgenic fish by immunohistochemistry (red staining). Scale bar represents 30 µm (A). Human λ LC protein is detectable in the serum from transgenic fish at 2 yr of age (B). Quantification of serum-free LC (sFLC) levels using recombinant H7 protein (rLC) as a standard for quantification (***P < 0.001) (C). A concentration (125 µg/ml) comparable to patients with AL amyloidosis was detectable in the serum. Con, control; TG, transgenic. |

Human AL-LC induced functional, biochemical, and ultrastructural alterations in the hearts of the transgenic fish. Representative images of ventricular area (VA) in diastole (VAd) and systole (VAs) obtained from color Doppler at 4 mo of age in control and transgenic fish (left). Quantification of fractional area change (FAC; top right). Heart rate of control and transgenic fish during acquisition (bottom right) (A). Peak aortic blood flow velocity at 4 mo in control and transgenic fish, n = 6 fish per experimental group (*P = 0.02; **P = 0.008) (B). Increased apoptosis was observed in the transgenic zebrafish at 3 mo old compared with control fish, as evidenced by the presence of TUNEL-positive nuclei in representative myocardial sections and an increase in cleaved caspase-3 detected by immunoblot of isolated heart protein lysates (P = 0.001) (C and D). Representative immunoblot showing increased LC3-II (P = 0.02) expression in transgenic myocardium compared with controls at 1 yr of age is indicative of abnormal authophagic flux (E). Representative images of VA in VAd and VAs obtained from color Doppler at 20 mo of age in control and transgenic fish (left). Quantification of FAC (top right). Heart rate of control and transgenic fish during acquisition (bottom right) (F). Peak aortic blood flow velocity at 20 mo in control and transgenic fish, n = 9 (control), n = 13 (transgenic) (*P = 0.02; **P = 0.009) (G). Scatter plot showing negative correlation between heart rate and aortic flow rate in transgenic fish (P = 0.06) (H). bpm, beats/min; Con, control; TG, transgenic. |
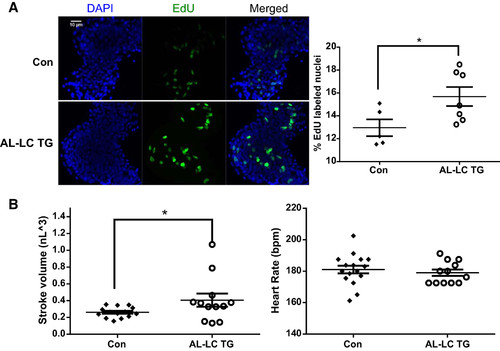
Early signs of functional as well as cellular compensation begin in AL-LC transgenic fish embryos. Increased proliferation as indicated by increased EdU-labeled nuclei (green) were detectable in the 48 hpf transgenic zebrafish hearts compared with control hearts (*P = 0.04) (A). Dimensional analysis to measure cardiac function was performed at 48 hpf as previously described in (23) revealing an increase in stroke volume (*P = 0.03, left) while maintaining a comparable heart rate (B). bpm, beats/min; Con, control; EdU, 5-ethynyl-2′-deoxyuridine; hpf, hours postfertilization; TG, transgenic.
PHENOTYPE:
|
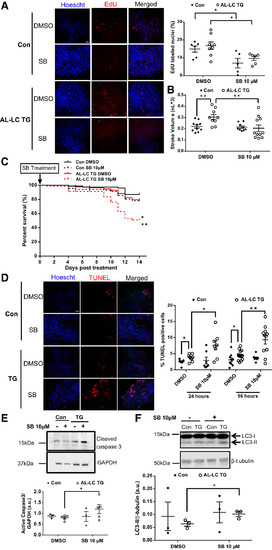
Proliferation inhibition in transgenic zebrafish using SB431542 sensitizes them to LC cardiac toxicity lowering survival, increasing cardiac cell death and dysfunction. Representative images (left) from isolated control and AL-LC TG embryonic zebrafish hearts following 24-h SB431542 treatment display a decrease in EdU-labeled nuclei. Quantification of EdU-positive cells in zebrafish heart following 24-h SB431542 treatment. n = 5–7 zebrafish embryos/group; P = 0.03 for control embryos with DMSO vs. SB431542; P = 0.02 for TG DMSO vs. SB431542 (A). Dimensional analysis performed as (23) at 72 hpf following a 24-h SB431542 treatment revealed a loss of the cardiac functional compensation by stroke volume (P = 0.02) (B). Kaplan-Meier curve shows that survival is significantly decreased in AL-LC transgenic zebrafish embryos treated with 10 µM SB431542 for 96 h administered starting at 2 days postfertilization (*P = 0.002 for control embryos with SB431542 vs. TG SB431542; **P = 0.0003 for TG with DMSO vs. SB431542); n ≥ 40 zebrafish embryos/group (C). Representative images of isolated control and AL-LC TG zebrafish hearts following 24-h and 96-h SB431542 treatment revealed increased TUNEL-stained nuclei (red, left). Quantification of TUNEL-positive cells in isolated zebrafish hearts following 24-h and 96-h SB431542 treatment. Treatment for both durations resulted in a significant increase in cell death in the AL-LC TG fish hearts, n = 7–14 zebrafish embryos/group; P = 0.02 at 24 h; P = 0.008 at 96 h (D). Further evidence of apoptosis was observed with an increase in cleaved caspase-3 protein by immunoblotting of the AL-LC TG embryos treated with 10 μM SB431542 (P = 0.048) (E). Indication of abnormal authophagic flux was observed via increased LC3-II protein levels as measured by immunoblotting of the AL-LC TG embryos treated with 10 μM SB431542 (P = 0.045). n = 3 separate experiments with 7–14 zebrafish embryos/group (F). Con, control; EdU, 5-ethynyl-2′-deoxyuridine; hpf, hours postfertilization; SB, SB431542; TG, transgenic.
EXPRESSION / LABELING:
PHENOTYPE:
|