FIGURE SUMMARY
Title

Intestinal Serum amyloid A suppresses systemic neutrophil activation and bactericidal activity in response to microbiota colonization

Authors
Murdoch, C.C., Espenschied, S.T., Matty, M.A., Mueller, O., Tobin, D.M., Rawls, J.F.
Source
Full text @ PLoS Pathog.

Saa mediates neutrophil behavior <italic>in vivo</italic>.

(A-B) Imaging and quantification of lyz:EGFP+ neutrophils recruited to tail wound margin over 6 hours following caudal fin amputation (dashed red line indicates wound margin; scale bar = 250 μm) (n ≥ 24 larvae / genotype at 6 hour time point). (C) Measurement of lyz:DsRed+ neutrophil speed from time-lapse imaging in caudal fin tissue over 6 hour period following amputation (n = 4 larvae / genotype, 87–112 cells tracked / genotype). (D-E) Representative images of 6 dpf Tg(lyz:DsRed) WT and saa-/- larvae (scale bar = 500 μm). (F) Enumeration of intestine-associated lyz:EGFP+ cells in 6 dpf larvae (n = 32–40 larvae / genotype). (G-J) Quantitative analysis of lyz:EGFP+ neutrophil behavior from time-lapse imaging of distinct anatomical compartments (intestine and trunk, ROIs in panel D) in 6 dpf larval zebrafish (6 larvae / genotype, ≥ 23 cells analyzed / genotype / tissue). Data analyzed by t-test. For panel B, statistical comparisons were performed within each time point. Data are presented as mean ± SEM. * p < 0.05, ** p < 0.01, *** p < 0.001, **** p < 0.0001.

Saa regulates neutrophil abundance and maturation.

(A) Flow cytometry analysis of lyz:EGFP+ neutrophil abundance from whole 6 dpf WT and saa mutant zebrafish larvae (results are combined from 3 independent experiments, ≥ 4 replicates / genotype / experiment, 60–90 larvae / replicate). (B-C) Morphological analysis of lyz:DsRed+ neutrophil cytospins stained with Wright-Giemsa from adult WT and saa mutant zebrafish kidneys (5–6 adult zebrafish kidneys / genotype / experiment, 2 independent experiments, n ≥ 199 cells analyzed / genotype / experiment) (scale bar = 10 μm). (D-F) qRT-PCR of leukocyte-associated transcripts lysozyme C (lyz), l-plastin (lcp), and colony-stimulating factor 3a (csf3a) from 6 dpf whole zebrafish larvae (n = 4 replicates / genotype / timepoint, 25–30 larvae / replicate). Data in panel A analyzed by t-test. Data in panel C analyzed by chi-squared test. Data in panels D-F analyzed by one-way ANOVA with Tukey’s multiple comparisons test. Data are presented as mean ± SEM. * p < 0.05, ** p < 0.01, *** p < 0.001, **** p < 0.0001.

Saa suppresses neutrophil transcriptional activation and bactericidal activity.

(A) qRT-PCR of pro-inflammatory mRNAs from sorted neutrophils from 6 dpf WT and saa mutant zebrafish larvae (5,000–12,000 lyz:EGFP+ cells / replicate, 3–6 replicates / genotype / experiment, 60–90 larvae / replicate). (B) Microscopic analysis revealed neutrophils isolated from adult zebrafish kidneys extend protrusions in response to bacterial signals ex vivo (white arrows; scale bar = 20 μm). (C)il1b expression in un-stimulated and E. coli exposed lyz:EGFP+ neutrophils from WT and saa mutant zebrafish following 4 hours ex vivo culture (3–5 replicates / genotype / condition). (D) CFU quantification of bacterial concentration following 4 hour co-culture of isolated lyz:EGFP+ neutrophils from WT and saa mutant zebrafish with E. coli (MOI 2). (E) Quantification of intracellular ROS levels by CellROX fluorescence from neutrophils cultured ex vivo with and without E. coli (lyz:EGFP+ cells isolated from 6 zebrafish adult kidneys / genotype, quantification of ≥ 177 cells / condition). In panels C and E, a one-way ANOVA with Tukey’s multiple comparisons test was used. Data in panels A and D were analyzed with a t-test. Data are presented as mean ± SEM. * p < 0.05, ** p < 0.01, *** p < 0.001, **** p < 0.0001.

EXPRESSION / LABELING:
Genes:
Fish:
Anatomical Term:
Stage: Day 6
PHENOTYPE:
Fish:
Observed In:
Stage: Day 6

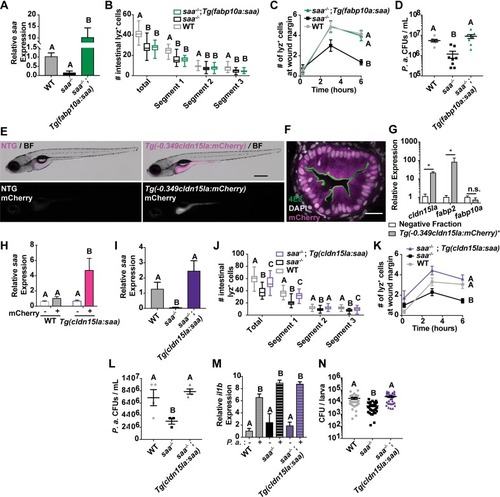
Intestinally-derived Saa regulates systemic neutrophil activity.

(A) qRT-PCR of saa from whole 6 dpf larvae of the indicated genotypes (n = 4 replicates / genotype, 25–30 larvae / replicate) (B) Enumeration of intestine-associated lyz:DsRed+ neutrophils along the anterior to posterior axis (segment 1 to segment 3) in 6 dpf larvae (n ≥ 25 larvae / genotype). (C) lyz:DsRed+ neutrophil recruitment to caudal fin wound 6 hours following amputation in 6 dpf zebrafish larvae (n ≥ 25 larvae / genotype at 6 hour time point). (D) CFU quantification of bacterial concentration following 4 hour co-culture of lyz:DsRed+ adult zebrafish neutrophils with P. aeruginosa (P.a., MOI 0.2) (8 replicates / genotype). (E) Representative stereoscope images of IEC specific mCherry expression in 6 dpf Tg(-0.349cldn15la:mCherry)rdu65 larvae compared to non-transgenic (NTG) controls. White dashed line indicates the intestine (scale bar = 500 μm). (F) Representative confocal micrograph of immunostained transverse section of Tg(-0.349cldn15la:mCherry) 6 dpf larvae labeled with the absorptive cell brush border-specific antibody 4E8 (scale bar = 20 μm). (G,H) qRT-PCR of cldn15la, fabp2, and fabp10a (G) from sorted Tg(-0.349cldn15la:mCherry)+ IECs and saa (H) from cldn15la:mCherry+ and negative cells isolated from 6 dpf larvae of indicated genotypes (13,000 –0.349cldn15la:mCherry+ or mCherry negative cells / replicate, 4 replicates / genotype, 30 larvae / replicate). (I) qRT-PCR of saa from 6 dpf larval dissected digestive tissue of the indicated genotypes (n = 4 replicates / genotype, 25–30 larvae / replicate) (J) Enumeration of intestine-associated lyz:DsRed+ neutrophils in 6 dpf larvae (n = 30 larvae / genotype). (K) lyz:DsRed+ neutrophil recruitment to caudal fin wound 6 hours following amputation in 6 dpf zebrafish larvae (n ≥ 18 larvae / genotype at 6 hour time point). (L) CFU quantification of bacterial concentration following 4 hour co-culture of lyz:DsRed+ adult zebrafish neutrophils with P. aeruginosa (P.a., MOI 0.2) (3–6 replicates / genotype). (M)il1b qRT-PCR from lyz:DsRed+ neutrophils co-cultured with and without P.a. ex vivo for 4 hours (n ≥ 2 replicates / condition). (N) CFU quantification of in vivo P.a. bacterial burden following systemic infection of larval zebrafish at 5 days post infection (dpi) (data from 3 independent experiments, n ≥ 30 larvae / genotype). Data in panels A-D and H-N were analyzed by one-way ANOVA with Tukey’s multiple comparisons test. A Mann-Whitney test was applied to panel G. For panels C and K, statistical comparisons were performed amongst samples within the same time point. Data are presented as mean ± SEM. * p < 0.05, ** p < 0.01, *** p < 0.001, **** p < 0.0001.

ZFIN is incorporating published figure images and captions as part of an ongoing project. Figures from some publications have not yet been curated, or are not available for display because of copyright restrictions.

ZFIN is incorporating published figure images and captions as part of an ongoing project. Figures from some publications have not yet been curated, or are not available for display because of copyright restrictions.

PHENOTYPE:
Fish:
Observed In:
Stage Range: Day 6 to Days 45-89

Characterization of the zebrafish cldn15la promoter used to drive intestine-specific saa expression.

(A) UCSC genome browser view of the zebrafish cldn15la gene locus with the translational start indicated by the red arrow. Pink bar represents the cloned 349 bp promoter region upstream of the cldn15la gene used to drive intestine-specific transgene expression. Tracks for vertebrate conservation, FAIRE-seq and motifs for transcription factors important of IEC gene expression programs (identified by HOMER) are shown below the locus [60]. (B) Expression pattern of endogenous cldn15la along the length of the intestine in adult zebrafish, as measured by microarray in Wang et al., 2010 [59]. (C) Representative stereoscope images of IEC specific cytosolic mCherry expression in 5 dpf Tg(-0.349cldn15la:mCherry)rdu65 larvae compared to non-transgenic (NTG) controls (scale bar = 500 μm). White dashed line indicates the intestine. (D) Quantification of mCherry fluorescence in the indicated tissues of 6 dpf Tg(-0.349cldn15la:mCherry) and non-transgenic control larvae demonstrated intestine-restricted mCherry reporter activity (n = 7 larvae / genotype). (E) Representative confocal micrographs of immunostained transverse sections of Tg(-0.349cldn15la:mCherry) 6 dpf larvae along the anterior-posterior axis labeled with the absorptive cell brush border-specific antibody 4E8 illustrated transgene expression in absorptive enterocytes (scale bar = 20 μm). (F)Representative immunofluorescence images of transverse sections from Tg(-0.349cldn15la:mCherry) 6 dpf larvae stained with secretory cell-specific antibody 2F11 demonstrated weak expression in secretory cells, including enteroendocrine cells (outlined by red dashed lines) and goblet cells (outlined by green dashed lines) (scale bar = 20 μm). (G)Gating strategy for isolation of -0.349cldn15la:mCherry+ IECs from larval zebrafish. (H) qPCR for mCherry transcript in sorted Tg(-0.349cldn15la:mCherry) IECs showed enrichment as compared to negative fraction (13,000 –0.349cldn15la:mCherry+ or mCherry negative cells / replicate, 4 replicates / genotype, 30 larvae / replicate). Data in panel D analyzed by one-way ANOVA with Tukey’s multiple comparison’s test. Data in panel H analyzed by a Mann-Whitney test. Data are presented as mean ± SEM. * p < 0.05, ** p < 0.01, *** p < 0.001, **** p < 0.0001.

EXPRESSION / LABELING:
Gene:
Fish:
Anatomical Term:
Stage Range: Day 5 to Day 6

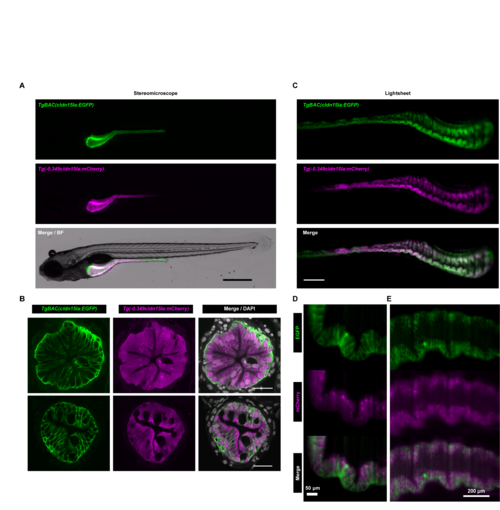
Comparison of Tg(-0.349cldn15la:mCherry) and TgBAC(cldn15la:EGFP)expression patterns.

(A) Widefield fluorescence images of IEC-specific cytosolic mCherry expression in 6 dpf double transgenic Tg(-0.349cldn15la:mCherry)rdu65TgBAC(cldn15la:EGFP)pd1034Tg larvae demonstrated overlap in mCherry and GFP expression domains (scale bar = 500 μm). (B)Representative confocal micrographs of immunolabeled transverse sections from anterior (upper) and posterior (lower) intestinal segments of Tg(-0.349cldn15la:mCherry)rdu65;TgBAC(cldn15la:EGFP)pd1034Tg 6 dpf larvae revealed expression of both mCherry and EGFP in IECs (scale bar = 20 μm). (C) Representative maximum intensity projections from single plane illumination microscopy (SPIM) z-stacks of Tg(-0.349cldn15la:mCherry)rdu65;TgBAC(cldn15la:EGFP) pd1034Tg 6 dpf larvae (scale bar = 500 μm). (D-E) High magnification single slice lightsheet images of the intestinal epithelium in a representative 6 dpf Tg(-0.349cldn15la:mCherry)rdu65;TgBAC(cldn15la:EGFP) pd1034Tg larva.

EXPRESSION / LABELING:
Genes:
Fish:
Anatomical Term:
Stage: Day 6
Acknowledgments
This image is the copyrighted work of the attributed author or publisher, and ZFIN has permission only to display this image to its users. Additional permissions should be obtained from the applicable author or publisher of the image. Full text @ PLoS Pathog.