
- Title
-
Distinct progenitor populations mediate regeneration in the zebrafish lateral line
- Authors
- Thomas, E.D., Raible, D.W.
- Source
- Full text @ Elife

Hair cell progenitors are replenished via proliferation of other support cells.(A, F) Timelines of single-ablation (A) and double-ablation (F) proliferation experiments. (B) Maximum projections of mock- (Mock) and neomycin-treated (Neo) neuromasts. EdU-positive cells are shown in magenta, anti-Parvalbumin-stained hair cells are shown in green, and DAPI-stained nuclei are shown in blue. Arrowheads indicate EdU-positive support cells. Scale bar = 10 μm. (C) Percentage of hair cells per neuromast labeled by EdU. Mock: 6.11 ± 8.69, n = 50 neuromasts (10 fish); Neo: 78.24 ± 20.69, n = 45 neuromasts (nine fish); mean ± SD; Mann Whitney U test, p<0.0001. (D) Total EdU-positive cells per neuromast. Mock: 2.78 ± 1.84, n = 50 neuromasts (10 fish); Neo: 8.18 ± 3.07, n = 45 neuromasts (nine fish); mean ± SD; Mann Whitney U test, p<0.0001. (E) Percentage of EdU-positive cells per neuromast that are either hair cells or support cells. Mock: 29.73% hair cells, 70.27% support cells, n = 50 neuromasts (10 fish); Neo: 72.02% hair cells, 27.98% support cells, n = 45 neuromasts (nine fish); mean ± SD. (G–N) Individual slices of a neuromast following two regenerations at two different planes: apical hair cell layer (G–J) and basal support cell layer (K–N). EdU (visualized by a Click-iT reaction) is labeled in magenta, BrdU (anti-BrdU) is labeled in cyan, and myo6b:GFP hair cells are labeled in green. Arrowheads indicate EdU/BrdU-positive hair cells, and asterisks indicate EdU-positive support cells. Scale bar = 10 μm. |

Genetic labeling of distinct support cell populations.(A, C, E) Maximum projections of neuromasts from sfrp1a:nlsEos (Peripheral, A), tnfsf10l3:nlsEos (AP, C), and sost:nlsEos (DV, E) fish. Converted nlsEos-positive cells are shown in magenta, and brn3c:GFP-positive hair cells are shown in green. Scale bar = 10 μm. (B, D, F) Percentage of hair cells per neuromast labeled by Peripheral (B), AP (D), and DV cells (F) at 5 and 8 dpf. (B) 5 dpf: 19.04 ± 19.86, n = 50 neuromasts (10 fish); 8 dpf: 19.46 ± 19.44, n = 50 neuromasts (10 fish); mean ± SD; Mann Whitney U test, p=0.7047. (D) 5 dpf: 5.71 ± 8.22, n = 50 neuromasts (10 fish); 8 dpf: 6.36 ± 9.57, n = 50 neuromasts (10 fish); mean ± SD; Mann Whitney U test, p=0.9668. (F) 5 dpf: 38.93 ± 13.46, n = 50 neuromasts (10 fish); 8 dpf: 55.78 ± 14.13, n = 50 neuromasts (10 fish); mean ± SD; Mann Whitney U test, p<0.0001. |
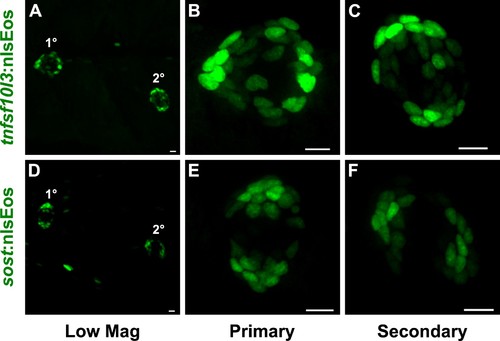
Asymmetry of support cell transgene expression in secondary neuromasts is orthogonal to primary neuromasts.(A–F) Maximum projections of lateral views of trunks (taken at 20x zoom) (A,D) or of individual neuromasts (B–C, E–F) from tnfsf10l3:nlsEos (A–C), and sost:nlsEos fish (D–F). Unconverted nlsEos-positive cells are shown in green. In Low Mag images (A,D), primary neuromasts are labeled with 1°, and secondary neuromasts are labeled with 2°. Scale bar = 10 μm. |
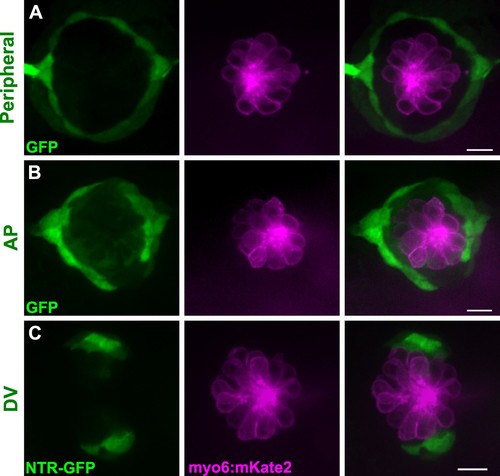
Support cell transgenes are not expressed in hair cells.(A–C) Maximum projections of neuromasts from Tg[sfrp1a:GFP]w222 (Peripheral, A), Tg[tnfsf10l3:GFP]w223 (AP, B), and sost:NTR-GFP (DV, C) fish. GFP-positive cells are shown in green, and hair cells are shown in magenta via myo6:mKate2. In all three populations, there is no GFP expression in hair cells. Scale bar = 10 μm |

Distinct support cell populations have different regenerative capacities.(A) Timeline of nlsEos fate mapping experiment. Fish were photoconverted at 5 dpf, treated with neomycin, then fixed and imaged 72 hr post treatment (8 dpf). (B, C, D) Maximum projections of neuromasts from sfrp1a:nlsEos (Peripheral, B), tnfsf10l3:nlsEos (AP, C), and sost:nlsEos (DV, D) fish following photoconversion and hair cell regeneration. Converted nlsEos-positive cells are shown in magenta, and brn3c:GFP-positive hair cells are shown in green. Arrowheads indicate nlsEos-positive hair cells. Scale bar = 10 μm. (E) Percentage of hair cells per neuromast labeled by nlsEos following regeneration. Sfrp1a:nlsEos (Peripheral): 3.59 ± 8.87, n = 50 neuromasts (10 fish); tnfsf10l3:nlsEos (AP): 20.28 ± 20.58, n = 50 neuromasts (10 fish); sost:nlsEos (DV): 60.87 ± 12.37, n = 50 neuromasts (10 fish); mean ± SD; Kruskal-Wallis test, Dunn’s post-test, p=0.003 (Peripheral vs. AP), p<0.0001 (Peripheral vs. DV, AP vs. DV). (F) Total nlsEos-positive support cells per neuromast prior to hair cell ablation. Sfrp1a:nlsEos (Peripheral): 14.30 ± 4.17, n = 50 neuromasts (10 fish); tnfsf10l3:nlsEos (AP): 22.8 ± 4.40, n = 50 neuromasts (10 fish); sost:nlsEos (DV): 23.86 ± 4.45, n = 50 neuromasts (10 fish); mean ± SD; Kruskal-Wallis test, Dunn’s post-test, p<0.0001 (Peripheral vs. AP, Peripheral vs. DV), p>0.9999 (AP vs. DV). |
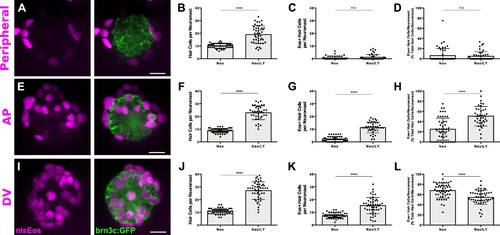
Notch signaling differentially regulates support cell populations.(A, E, I) Maximum projections of neuromasts expressing sfrp1a:nlsEos (Peripheral, A), tnfsf10l3:nlsEos (AP, E), and sost:nlsEos (DV, I) following Notch-inhibited hair cell regeneration. Converted nlsEos-positive cells are shown in magenta, and brn3c:GFP-positive hair cells are shown in green. Scale bar = 10 μm. (B) Total number of hair cells per neuromast in sfrp1a:nlsEos fish following hair cell regeneration. Neo: 10.28 ± 1.88, n = 50 neuromasts (10 fish); Neo/LY: 19.07 ± 6.79, n = 46 neuromasts (10 fish); mean ± SD; Mann Whitney U test, p<0.0001. (C) Sfrp1a:nlsEos-positive hair cells per neuromast following hair cell regeneration. Neo: 0.62 ± 1.28, n = 50 neuromasts (10 fish); Neo/LY: 1.15 ± 2.16, n = 46 neuromasts (10 fish); mean ± SD; Mann Whitney U test, p=0.2481. (D) Percentage of sfrp1a:nlsEos-labeled hair cells per neuromast following hair cell regeneration. Neo: 6.31 ± 13.83, n = 50 neuromasts (10 fish); Neo/LY: 4.95 ± 8.82, n = 46 neuromasts (10 fish); mean ± SD; Mann Whitney U test, p=0.5148. (F) Total number of hair cells per neuromast in tnfsf10l3:nlsEos fish following hair cell regeneration. Neo: 8.84 ± 1.75, n = 50 neuromasts (10 fish); Neo/LY: 22.93 ± 5.45, n = 40 neuromasts (eight fish); mean ± SD; Mann Whitney U test, p<0.0001. (G) Tnfsf10l3:nlsEos-positive hair cells per neuromast following hair cell regeneration. Neo: 2.22 ± 1.94, n = 50 neuromasts (10 fish); Neo/LY: 11.38 ± 4.23, n = 40 neuromasts (eight fish); mean ± SD; Mann Whitney U test, p<0.0001. (H) Percentage of tnfsf10l3:nlsEos-labeled hair cells per neuromast following hair cell regeneration. Neo: 25.19 ± 21.72, n = 50 neuromasts (10 fish); Neo/LY: 50.68 ± 19.23, n = 40 neuromasts (eight fish); mean ± SD; Mann Whitney U test, p<0.0001. (J) Total number of hair cells per neuromast in sost:nlsEos fish following hair cell regeneration. Neo: 10.94 ± 2.23, n = 50 neuromasts (10 fish); Neo/LY: 27.06 ± 6.90, n = 48 neuromasts (10 fish); mean ± SD; Mann Whitney U test, p<0.0001. (K) Sost:nlsEos-positive hair cells per neuromast following hair cell regeneration. Neo: 7.40 ± 2.13, n = 50 neuromasts (10 fish); Neo/LY: 15.25 ± 6.36, n = 48 neuromasts (10 fish); mean ± SD; Mann Whitney U test, p<0.0001. (L) Percentage of sost:nlsEos-labeled hair cells per neuromast following hair cell regeneration. Neo: 67.86 ± 14.63, n = 50 neuromasts (10 fish); Neo/LY: 54.69 ± 14.01, n = 48 neuromasts (10 fish); mean ± SD; Mann Whitney U test, p<0.0001. |

Differences in overlap between sost:NTR-GFP and sost:nlsEos populations.(A–B) Maximum projections of neuromasts from sost:NTR-GFP; sost:nlsEos fish at 3 dpf (A) and 5 dpf (B). Sost:NTR-GFP cells are shown in green and sost:nlsEos cells are shown in magenta. Arrowheads indicate cells expressing sost:nlsEos but not sost:NTR-GFP. Scale bar = 10 μm. (C) Support cells per neuromast expressing either NTR-GFP and nlsEos (green) or nlsEos only (magenta) at 3 dpf and 5 dpf. NTR-GFP/nlsEos: 9.04 ± 2.39 (3 dpf) vs. 8.47 ± 2.27 (5 dpf), n = 49 neuromasts each (10 fish each); nlsEos only: 6.10 ± 2.27 (3 dpf) vs. 10.86 ± 2.72 (5 dpf), n = 49 neuromasts each (10 fish each); mean ± SD; Kruskal-Wallis test, Dunn’s post-test, p>0.9999 (NTR-GFP/nlsEos 3 dpf vs. 5 dpf), p<0.0001 (nlsEos only 3 dpf vs. 5 dpf). (D–F) Maximum projections of neuromasts from sost:NTR-GFP; sost:nlsEos fish following mock treatment (D; Mock), Mtz at 5 dpf (E; Mtz5), and Mtz at 3 dpf and 5 dpf (F; Mtz3/5). Sost:NTR-GFP cells are shown in green and sost:nlsEos cells are shown in magenta. Scale bar = 10 μm. (G) Support cells per neuromast solely expressing sost:nlsEos following Mtz treatment. Mock: 11.18 ± 2.04, n = 50 neuromasts (10 fish); Mtz5: 9.72 ± 2.03, n = 50 neuromasts (10 fish); Mtz3/5: 6.76 ± 2.12, n = 50 neuromasts (10 fish); mean ±SD; Kruskal-Wallis test, Dunn’s post-test, p=0.0288 (Mock vs. Mtz5), p<0.0001 (Mock vs. Mtz3/5, Mtz5 vs. Mtz3/5). |
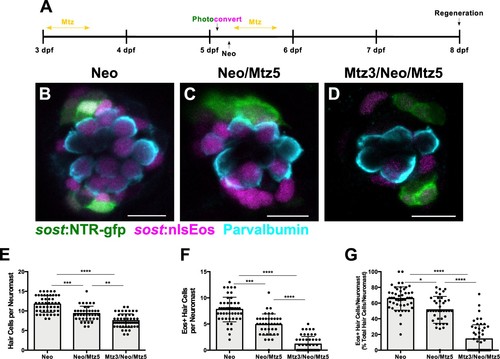
Ablation of DV cells decreases number of regenerated hair cells.(A) Timeline of DV cell-ablation experiment. Larvae were treated with Mtz at 3 dpf, photoconverted, then treated with neomycin, then treated with Mtz again at 5 dpf, and fixed and immunostained at 72 hpt (8 dpf). (B–D) Maximum projections of neuromasts from sost:NTR-GFP; sost:nlsEos fish following neomycin (B; Neo), neomycin and Mtz (C; Neo/Mtz5), and Mtz, neomycin, and Mtz treatments (D; Mtz3/Neo/Mtz5). Sost:NTR-GFP cells are shown in green, sost:nlsEos cells are shown in magenta, and anti-Parvalbumin-stained hair cells are shown in cyan. Scale bar = 10 μm. (E) Total hair cells per neuromast following regeneration. Neo: 11.73 ± 2.10, n = 49 neuromasts (10 fish); Neo/Mtz5: 9.33 ± 1.88, n = 39 neuromasts (8 fish); Mtz3/Neo/Mtz5: 7.52 ± 1.74, n = 50 neuromasts (10 fish); mean ± SD; Kruskal-Wallis test, Dunn’s post-test, p=0.0001 (Neo vs. Neo/Mtz5), p<0.0001 (Neo vs. Mtz3/Neo/Mtz5), p=0.0016 (Neo/Mtz5 vs. Mtz3/Neo/Mtz5). (F) Sost:nlsEos-positive hair cells per neuromast following regeneration. Neo: 7.78 ± 2.36, n = 49 neuromasts (10 fish); Neo/Mtz5: 4.90 ± 2.02, n = 39 neuromasts (eight fish); Mtz3/Neo/Mtz5: 1.16 ± 1.46, n = 50 neuromasts (10 fish); mean ± SD; Kruskal-Wallis test, Dunn’s post-test, p=0.0003 (Neo vs. Neo/Mtz5), p<0.0001 (Neo vs. Mtz3/Neo/Mtz5, Neo/Mtz5 vs. Mtz3/Neo/Mtz5). (G) Percentage of hair cells per neuromast labeled by sost:nlsEos following regeneration. Neo: 65.81 ± 14.89, n = 49 neuromasts (10 fish); Neo/Mtz5: 51.40 ± 17.17, n = 39 neuromasts (8 fish); Mtz3/Neo/Mtz5: 14.29 ± 18.10, n = 50 neuromasts (10 fish); mean ± SD; Kruskal-Wallis test, Dunn’s post-test, p=0.0147 (Neo vs. Neo/Mtz5), p<0.0001 (Neo vs. Mtz3/Neo/Mtz5, Neo/Mtz5 vs. Mtz3/Neo/Mtz5). |

DV cell-ablation reduces the number of supernumerary hair cells formed during Notch-inhibited hair cell regeneration.(A) Timeline of dual DV cell-ablation, Notch-inhibition experiment. Sost:NTR-GFP larvae were treated with Mtz at 3 dpf, treated with neomycin at 5dpf, then co-treated with Mtz and LY411575 for 8 hr, then washed out and treated with LY411575 for 16 additional hours (24 hr total LY). (B–E) Maximum projections of sost:NTR-GFP neuromasts following normal hair cell regeneration (B; Neo), Notch-inhibited hair cell regeneration (C; Neo/LY), DV cell-ablated hair cell regeneration (D; Mtz3/Neo/Mtz5), and DV cell-ablated and Notch-inhibited hair cell regeneration (E; Mtz3/Neo/Mtz5/LY). Sost:NTR-GFP cells are shown in green, and anti-Parvalbumin immunostained hair cells are shown in magenta. Scale bar = 10 μm. (F) Total number of hair cells per neuromast following hair cell regeneration. Neo: 9.42 ± 1.85, n = 50 neuromasts (10 fish); Neo/LY: 21.08 ± 4.42, n = 50 neuromasts (10 fish); Mtz3/Neo/Mtz5: 6.86 ± 1.76, n = 50 neuromasts (10 fish); Mtz3/Neo/Mtz5/LY: 15.06 ± 3.51, n = 50 neuromasts (10 fish); mean ± SD; Kruskal-Wallis test, Dunn’s post-test, p<0.0001 (Neo vs. Neo/LY; Mtz3/Neo/Mtz5 vs. Mtz3/Neo/Mtz5/LY), p=0.0058 (Neo vs. Mtz3/Neo/Mtz5), p=0.0029 (Neo/LY vs. Mtz3/Neo/Mtz5/LY). PHENOTYPE:
|

AP cells and DV cells define separate progenitor populations.(A–C) Maximum projections of neuromasts from tnfsf10l3:nlsEos (AP, (A), sost:nlsEos (DV, (B), and tnfsf10l3:nlsEos/sost:nlsEos fish (AP + DV, (C) following photoconversion and regeneration. Converted nlsEos-positive cells are shown in magenta, and brn3c:GFP-positive hair cells are shown in green. Arrowheads indicate nlsEos-positive hair cells. Scale bar = 10 μm. (D) Number of nlsEos-positive hair cells per neuromast in each of the nlsEos lines following regeneration. Tnfsf10l3:nlsEos (AP): 2.4 ± 1.84, n = 50 neuromasts (10 fish); sost:nlsEos (DV): 6.34 ± 1.87, n = 50 neuromasts (10 fish); tnfsf10l3:nlsEos/sost:nlsEos (AP + DV): 8.24 ± 1.99, n = 50 neuromasts (10 fish); mean ±SD; Kruskal-Wallis test, Dunn’s post-test, p<0.0001 (AP vs. DV, AP vs. AP + DV), p=0.0031 (DV vs. AP + DV). (E) Percentage of hair cells per neuromast labeled by nlsEos lines following regeneration. AP: 27.59 ± 20.21, n = 50 neuromasts (10 fish); DV: 65.16 ± 13.89, n = 50 neuromasts (10 fish); AP + DV: 87.57 ± 13.02, n = 50 neuromasts (10 fish); mean ± SD; Kruskal-Wallis test, Dunn’s post-test, p<0.0001 (all comparisons). EXPRESSION / LABELING:
|

AP population doesn’t compensate for the loss of the DV population during hair cell regeneration.(A–B) Maximum projections of tnfsf10l3:nlsEos; sost:NTR-GFP neuromasts following normal hair cell regeneration (A; Neo) or DV cell-ablated hair cell regeneration (B; Mtz3/Neo/Mtz5). Sost:NTR-GFP cells are shown in green, tnfsf10l3:nlsEos cells are shown in magenta, and anti-Parvalbumin-stained hair cells are shown in cyan. Arrowheads indicate nlsEos-positive hair cells. Scale bar = 10 μm. (C) Total number of hair cells per neuromast following hair cell regeneration. Neo: 10.36 ± 1.60, n = 50 neuromasts (10 fish); Mtz3/Neo/Mtz5: 7.98 ± 1.74, n = 50 neuromasts (10 fish); mean ± SD; Mann Whitney U test, p<0.0001. (D) Number of nlsEos-positive hair cells per neuromast following hair cell regeneration. Neo: 2.88 ± 1.83, n = 50 neuromasts (10 fish); Mtz3/Neo/Mtz5: 3.14 ± 1.43, n = 50 neuromasts (10 fish); mean ± SD; Mann Whitney U test, p=0.3855. (E) Percentage of hair cells per neuromast labeled by nlsEos following hair cell regeneration. Neo: 27.26 ± 16.00, n = 50 neuromasts (10 fish); Mtz3/Neo/Mtz5: 40.43 ± 19.44, n = 50 neuromasts (10 fish); mean ± SD; Mann Whitney U test, p=0.0002. |
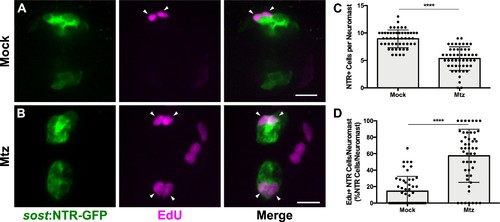
DV population regenerates via proliferation.(A–B) Maximum projections of neuromasts from sost:NTR-GFP fish either untreated (A; Mock) or treated with 10 mM Mtz (B; Mtz). Sost:NTR-GFP cells are shown in green and EdU-positive cells are shown in magenta. Arrowheads indicate EdU-positive sost:NTR-GFP cells. Scale bar = 10 μm. (C) Total number of sost:NTR-GFP cells per neuromast following DV cell regeneration. Mock: 8.94 ± 1.62, n = 50 neuromasts (10 fish); Mtz: 5.34 ± 2.14, n = 50 neuromasts (10 fish); mean ± SD; Mann Whitney U test, p<0.0001. (D) Percentage of sost:NTR-GFP cells per neuromast labeled by EdU following DV cell regeneration. Mock: 14.47 ± 17.95, n = 50 neuromasts (10 fish); Mtz: 57.49 ± 32.34, n = 50 neuromasts (10 fish); mean ± SD; Mann Whitney U test, p<0.0001. |