- Title
-
In Vivo imaging of β-cell function reveals glucose-mediated heterogeneity of β-cell functional development
- Authors
- Zhao, J., Zong, W., Zhao, Y., Gou, D., Liang, S., Shen, J., Wu, Y., Zheng, X., Wu, R., Wang, X., Niu, F., Wang, A., Zhang, Y., Xiong, J.W., Chen, L., Liu, Y.
- Source
- Full text @ Elife
|
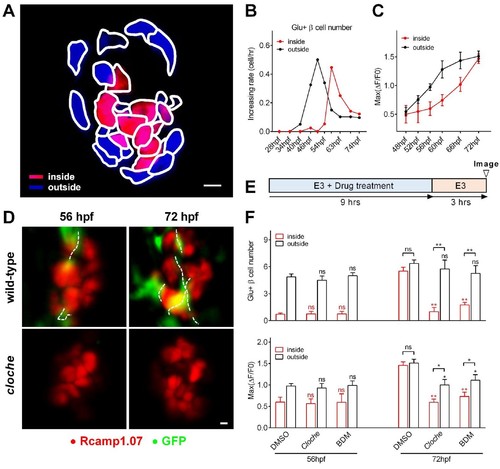
Sequential functional acquisition of β-cells from the mantle to the core of the islet was coordinated by islet microcirculation.(A) A schematic illustrating the classification of β-cells into two populations: the cells in the outside (mantle, blue) and the cells in the inside (core, red) of the islet. (B) Time-dependent increases in the number of glucose-responsive β-cells in the mantle (dark) and core (red) of the islet. n = 12–16 embryos per stage. (C) Time-dependent increases in the maximum amplitude of the glucose-triggered Ca2+ transients in β-cells from the mantle and the core of the islet. n = 12–16 embryos per stage. (D) Representative 3D-projections of the β-cells (red) and blood vessels (green) in live wild type or cloche-/- Tg (ins:Rcamp1.07);Tg (flk1:GFP) embryos. (E) The experimental design for 2,3-BDM treatment used in (F). (F) The number of glucose-responsive β-cells (top) and their maximal Ca2+ responses to glucose (bottom) in the mantle and the core of the islets in cloche-/- mutants and 2,3-BDM-treated embryos. n = 4–6 embryos per stage. *p<0.05, **p<0.01; ns, not significant. Scale bars: 10 μm; scale bars apply to (A) and (D). See also Figure 2—figure supplements 1–3 and Video 4. |
|
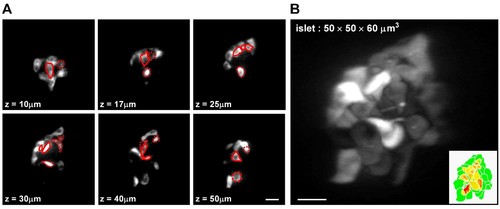
Categorization of β-cells based on their mantle/core localization in the islet.(A) Representative z-stack images of β-cells in a live Tg (ins:Rcamp1.07) zebrafish embryo at 72 hpf. Red solid circles mark β-cells in the islet core determined in the current focal plane; red dotted circles mark β-cells in the islet core determined in other focal planes. (B) 3D-projection of the islet showed in (A). The inset describes an illustration of β-cells in the mantle (green) and β-cells in the core (yellow to red) of the islet. Scale bars: 10 μm; scale bars apply to (A–B). |
|
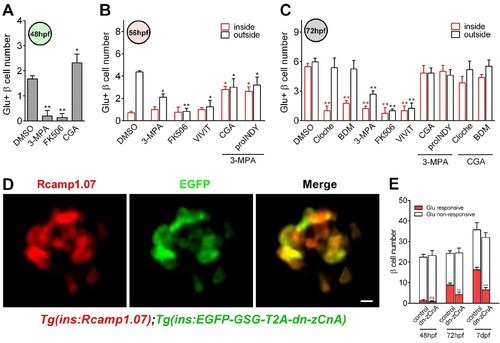
Calcineurin/NFAT signaling acted as the downstream of glucose to initiate and enhance β-cell functionality.(A) Numbers of glucose-responsive β-cells in 48 hpf embryos that had been treated with the indicated reagents. n = 4–8 embryos per condition. *p<0.05, **p<0.01. (B) Numbers of glucose-responsive β-cells in the mantle and the core of the islet in 56 hpf embryos that had been treated with the indicated reagents. n = 5–9 embryos per condition. *p<0.05, **p<0.01. (C) Numbers of glucose-responsive β-cells in the mantle and the core of the islet in 72 hpf embryos that had been treated with the indicated reagents. n = 5–9 embryos per condition. **p<0.01. (D) Representative two-photon images of Rcamp1.07 (left), EGFP (middle) and the merged image (right) of the islet cells in a living Tg (ins:Rcamp1.07);Tg (ins:EGFP-GSG-T2A-dn-zCnA) embryo. (E) Numbers of glucose-responsive β-cells in age-matched controls and dn-zCnA-expressing embryos at 48 hpf, 72 hpf and seven dpf. n = 4–6 embryos per stage. **p<0.01, ***p<0.001; ns, not significant. Scale bar: 10 μm. See also Figure 4—figure supplements 1–2 and Videos 5–6. |
|
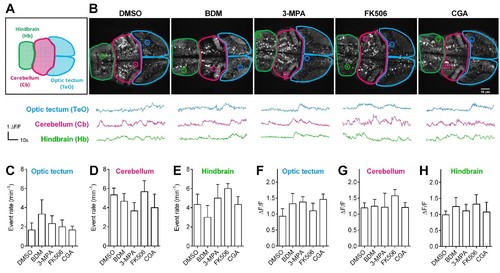
Pharmacological treatments did not affect calcium activities of CNS neurons in living Tg (elavl3:Gcamp6s) zebrafish embryos.(A) The schematic illustrates three different brain regions in zebrafish embryos. (B) Representative 72 hpf Tg (elavl3:Gcamp6s) embryos (top) and time courses of calcium transients (bottom) from individual neurons in living embryos that had been treated with the indicated pharmacological reagents. (C–E) Quantification of event rate of calcium transients from neurons in living 72 hpf Tg (elavl3:Gcamp6s) embryos that had been treated with the indicated pharmacological reagents used in this study. 10–20 neurons were randomly selected in the indicated three brain regions from three embryos per condition. (F–H) Average amplitudes of calcium transients from neurons in living 72 hpf Tg (elavl3:Gcamp6s) embryos that had been treated with the indicated pharmacological reagents used in this study. 10–20 neurons were randomly selected in the indicated three brain regions from three embryos per condition. |
|
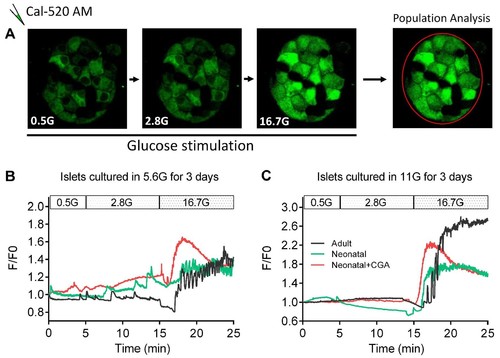
Direct activation of calcineurin promoted the optimal maturity of neonatal mouse β-cells in isolated islets in vitro, as indicated by ex vivo islet calcium imaging.(A) The experimental design for ex vivo islet calcium imaging used in (B–C). (B–C) Representative time courses of calcium transients under indicated glucose stimulations in islets that had been cultured in media with 5.6 mM glucose (B) and 11 mM glucose (C) for 3 days with or without CGA. |
|
MafA antibody used in mouse exhibited non-specific cytoplasmic signals in β-cells of zebrafish. |
|
MafA was not expressed in the β-cells, but was expressed in the exocrine pancreas in larval zebrafish. |
|
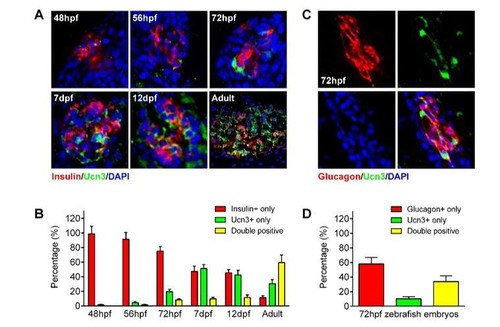
ucn3 expression pattern in zebrafish islets at different developmental stages.(A) Immunofluorescent labelling of insulin and ucn3 in zebrafish islets at indicated stages. (B) Quantification of ucn3-positive β-cells in zebrafish islets at the indicated stages in A. n = 6-12 islets per condition. (C) Immunofluorescent labelling of glucagon and ucn3 in zebrafish islets at 72 hpf. (D) Quantification of ucn3-positive α-cells in zebrafish islets at 72 hpf. n = 10 embryos. |

