
- Title
-
Peri-arterial specification of vascular mural cells from naïve mesenchyme requires Notch signaling
- Authors
- Ando, K., Wang, W., Peng, D., Chiba, A., Lagendijk, A., Barske, L., Crump, J.G., Stainier, D.Y.R., Lendahl, U., Koltowska, K., Hogan, B.M., Fukuhara, S., Mochizuki, N., Betsholtz, C.
- Source
- Full text @ Development

EXPRESSION / LABELING:
|

The emergence of pdgfrbhigh MCs was inhibited by DAPT treatment during the specification period. (A,B) Confocal stack images of pdgfrbhigh MCs at 72 hpf in brain vessels (A) or trunk vessels (B) after treatment with vehicle-DMSO (control), 50 µM SB431542 or 100 μM DAPT from 24 hpf through 72 hpf. E3 medium-containing inhibitors were replaced with fresh ones every 12 h. (C,D) Brain vessels (C) and trunk vessels (D) of 72 hpf TgBAC(pdgfrb:GFP);Tg(fli1a:Myr-mCherry) larvae injected with 6 ng alk1 MO. Note that alk1 MO induced abnormal vasculature in the cerebral base or caudal vein but did not inhibit the emergence of pdgfrbhigh MCs. (E) Trunk vessels of TgBAC(pdgfrb:GFP);Tg(fli1a:Myr-mCherry) larvae treated with vehicle-DMSO or 100 µM DAPT at the time point indicated in the top schematic. Boxed regions are enlarged to the right. (F) Confocal stack images of TgBAC(pdgfrb:GFP);Tg(kdrl:Hsa.HRAS-mCherry) larvae treated with either 1% DMSO, 25 μM DAPT or 5 μM LY411575 at the time point indicated in the schematic on the right. Arrows and arrowheads indicate pdgfrbhigh MCs beneath DA and in BSA/PCS/BA/ISVs, respectively. Quantitative results are shown on the right of each representative image. Bars and circles in the graph indicate averages and each value of observed larvae, respectively. ****P<0.0001, ***P<0.001 and **P<0.01, significant difference between control and indicated group. BA, basilar artery; CA, caudal artery; CV, caudal vein; HP, hypochord; n.s., not significant; PCS, posterior communicating segment. Scale bars: 30 µm in A,C; 50 µm in B,D,E; 20 µm in enlarged images in B,D,E; 15 µm in F. EXPRESSION / LABELING:
PHENOTYPE:
|

Both Notch2 and Notch3 are essential for pdgfrbhigh MC emergence. (A,B) Confocal stack images of the brain (A) or trunk vessels (B) of 78 hpf TgBAC(pdgfrb:GFP);Tg(fli1a:Myr-mCherry)larvae injected with 10 ng control MO, 10 ng notch2 MO or 5 ng each of notch2 and notch3 MOs. (C) The percentage of aISV with pdgfrbhigh MCs, as observed in B (n≥11). (D) Confocal stack images of the brain vessels of 57 hpf TgBAC(abcc9:GAL4FF);Tg(UAS:GFP);Tg(kdrl:DsRed2)embryos injected with 10 ng control MO or 5 ng each of notch2 and notch3 MOs. (E,G) Confocal images of brain (E) and trunk (G) vasculature of the wild-type (WT) siblings or mutants carrying both heterozygous notch2 and notch3 mutations (N2-Het/N3-Het), homozygous notch2mutation (N2-null/N3-WT), both homozygous notch2 and heterozygous notch3 mutations (N2-null/N3-Het), homozygous notch3 mutation (N2-WT/N3-null) or both heterozygous notch2 and homozygous notch3 mutations (N2-Het/N3-null) with the TgBAC(pdgfrb:GFP);Tg(fli1a:Myr-mCherry) background at 78 hpf. (F,H,I) The number of pdgfrbhigh MCs in BCA and PCS in notch2and notch3 mutants, as shown in panel E (F), the percentage of the DA with MC coverage (MC-covered/total DA length in observed areas were measured using Imaris software) (H) or the percentage of embryos with pdgfrbhigh MCs in aISV (I) in notch2 and notch3 mutants, as shown in G. The total number of observed larvae are shown on the top of each bar in I. (J) Confocal stack image of the trunk vessels of 72 hpf TgBAC(pdgfrb:GFP);Tg(fli1a:Myr-mCherry) larvae injected with control MO or low dose (0.75 ng each) of notch2 and notch3 MO combined with subsequent treatment with DMSO or low dose (5 µM) of DAPT from 36 to 72 hpf as shown in the scheme to the top right of J. (K,L) The percentage of aISV with pdgfrbhigh MCs (K) and pdgfrbhigh MCs number in aISV on one side of the observed trunk (L), as observed in J. Data are mean±s.e.m. (n≥4). (M) Confocal stack image of the hyaloid vessels of 78 hpf TgBAC(pdgfrb:GFP);Tg(fli1a:Myr-mCherry) larvae injected with 10 ng control MO (top) or 5 ng each of notch2 and notch3 MO (bottom). Boxed regions are enlarged to the bottom or right. Arrows and arrowheads indicate pdgfrbhigh MCs beneath the DA and in ISV/BCA/PCS, respectively. *P<0.05, **P<0.01, ***P<0.001, significant difference between two groups. n.s., not significant. In F and H, significant difference between WT and indicated mutant group. HP, hypochord; NC, notochord; PCV, posterior cardinal vein. Scale bars: 50 µm; 20 µm in enlarged images. PHENOTYPE:
|

Depletion of both notch2 and notch3 hardly affected Notch-Rbpj-mediated transcriptional activity in ECs. (A) Confocal stack images of the trunk vasculature of the wild-type (WT) sibling or notch2/notch3 mutants with the Tg(fli1a:H2B-GFP);Tg(TP1:H2B-mCherry) background at 74 hpf. (B) The percentage of ECs in observed trunk region with TP1:H2B-mCherry expression, as observed in A. Total number of EC nuclei marked by fli1a:H2B-GFP and the number of EC nuclei positive for both fli1a:H2B-GFP and TP1:H2B-mCherry were counted using Imaris software. Bars and circles indicate averages and each value of observed larvae, respectively. (C) Confocal images of trunk vasculature of the 50 hpf Tg(fli1a:H2B-GFP);Tg(TP1:H2B-mCherry) embryos injected with 10 ng control MO (left), 5 ng each of notch2 and notch3 MOs (middle, N2/N3 MOs) or 10 ng of dll4 MO (right). (D) The expression of deltaC or ephrin-B2a mRNA, as detected by whole-mount in situ hybridization, in 48 hpf embryos injected with 10 ng control MO or 5 ng each of notch2 and notch3 MOs. Numbers indicate embryos with the similar expression as shown in each image/total number of embryos. Two independent experiments were performed for each marker with at least seven embryos per experiment. In A and C, arrowheads indicate ECs with TP1:H2B-mCherry expression; boxed regions are enlarged to the right. Scale bars: 50 µm; 10 µm in enlarged images. DLAV, dorsal longitudinal anastomotic vessels; PCV, posterior cardinal vein. EXPRESSION / LABELING:
PHENOTYPE:
|
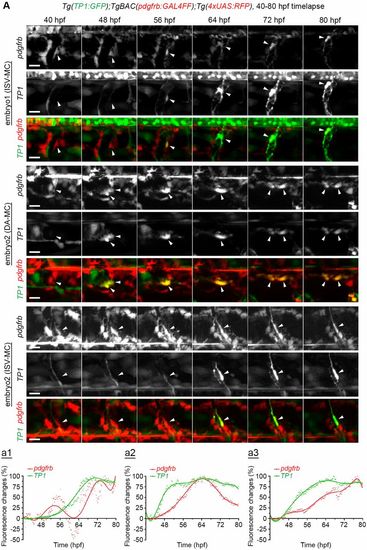
Time-lapse imaging of TP1 reporter expression in MCs. (A) Time-lapse imaging of the trunk region (ISV or DA) of Tg(TP1:GFP);TgBAC(pdgfrb:GAL4FF);Tg(4xUAS:RFP) every 12 min (see also Movie 1). Increase of RFP signal was observed in the cells positive for GFP expression (Notch activation) (arrows). Representative images at indicated time points and fluorescence changes (a1-a3) showing % of the peak value of pdgfrb or TP1 reporter fluorescence intensity after the subtraction of each fluorescent intensity of the first flame. Quantifications a1 (dorsal side) and a2 (ventral side) correspond to one of the ISV-MCs in embryo 1 (see Movie 1), and a3 corresponds to an ISV-MC in embryo 3 (images not shown). Red dots, pdgfrb reporter; green dots, TP1 reporter. Polynomial fitting curves for the pdgfrb (red line) and TP1 (green line) were assigned using the polyfit function in MATLAB with the degree of 7. Scale bars: 15 μm. EXPRESSION / LABELING:
|
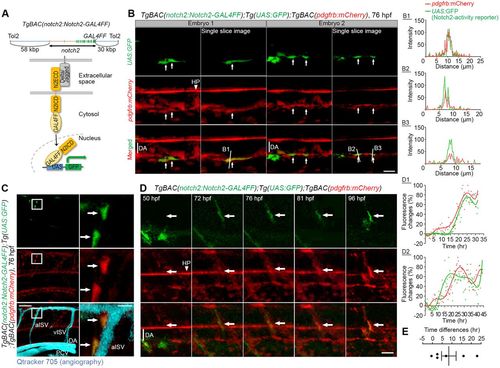
Notch activation in pdgfrbhigh MCs. (A) Schematic structure of the BAC clone (CH211-39M8) which was used to generate TgBAC(notch2:Notch2-GAL4FF) for visualizing Notch2-activated cells. A cDNA encoding GAL4FF was inserted at the C terminus of the notch2 gene. Notch2 intracellular region (N2ICD) fused with GAL4FF is proteolytically released and translocated to the nucleus upon Notch2 activation, therefore, Notch2 activated cells can be monitored by the expression of proteins such as GFP driven by the UAS/GAL4FF system. (B) Confocal images of the DA in TgBAC(notch2:Notch2-GAL4FF);Tg(UAS:GFP);TgBAC(pdgfrb:mCherry) larvae at 76 hpf. Left, stack images. Right, single slice images from stack images on the left. Arrows indicate pdgfrbhigh MCs beneath the DA with Notch2 activation. The fluorescence intensity profile of pdgfrb:mCherry (red line) and UAS:GFP (green line) along the line in the single slice images (B1-B3) are shown on the right, indicating the colocalization of mCherry and GFP expression. The x-axes show distance from the beginning of the line. (C) Confocal stack images of the trunk vessels of TgBAC(notch2:Notch2-GAL4FF);Tg(UAS:GFP);TgBAC(pdgfrb:mCherry) larvae at 76 hpf. Vascular structure was visualized by injection of Qtracker 705 vascular labels (aqua) into the circulation. Boxed regions depicting pdgfrbhigh MCs in aISV are enlarged to the right. Arrows indicate the Notch2-activated pdgfrbhigh MCs. Notch2-activity-positive MCs in ISVs/DA at 74 hpf were seen in 31.6% (12/38) of embryos shown. (D) Time-lapse imaging of the trunk region (ISV) of TgBAC(notch2:Notch2-GAL4FF);Tg(UAS:GFP);TgBAC(pdgfrb:mCherry) embryo at the indicated time points. Note that Notch2 activation precedes the increase of pdgfrb expression. GFP signal was absent at 50 hpf, but induced in pdgfrblow cells after 72 hpf. Subsequently, pdgfrb:mCherry expression was increased in Notch2-activated pdgfrblow cells (arrows). Representative fluorescence changes (% of the peak value of pdgfrb- or Notch2-activity reporter fluorescence) are shown on the right (D1, ISV-MC; D2, DA-MC). Red dots, pdgfrbreporter. Green dots, Notch2-activity reporter. Polynomial fitting curves for the pdgfrb (red line) and Notch2-activity reporter (green line) were assigned using the polyfit function in MATLAB with the degree of 7. The x-axes show the relative time. (E) Comparison of the time showing the highest value of Notch2 activity and the pdgfrb reporter in fitting curve. The data are mean±s.e.m. (n=6). Note that the time showing the highest GFP fluorescence preceded that of mCherry fluorescence by more than 8 h on average, indicating that Notch2 is activated before the onset of pdgfrb increase. HP, hypochord; N2ECD, Notch2 extracellular region; PCV, posterior cardinal vein. Scale bars: 20 µm in B,D: 50 µm in C: 10 µm in enlarged images in C. |

TgBAC(abcc9:GAL4FF) zebrafish line. (A) Lateral view of the TgBAC(abcc9:GAL4FF);Tg(UAS:GFP) larva at 4 dpf. Upper, the merged image of bright field image and UAS:GFP; lower, UAS:GFP. (B-D) Lateral view of confocal stack image of trunk vasculature of TgBAC(abcc9:GAL4FF);Tg(UAS:GFP);Tg(kdrl:DsRed2) larva (B), trunk (C) or brain vasculature (D) of TgBAC(abcc9:GAL4FF);Tg(UAS:GFP);Tg(pdgfrb:mCherry) larva at 96 hpf. Lateral view, anterior to the left. Note that abcc9 reporter positive cells were hardly detected beneath the DA (B, C). In D, vascular structure was visualized by injecting Qdot655 into the circulation (aqua). |

alk1 MO efficacy and effects of DAPT on MC emergence. (A) The schematic model of alk1 MO target site (left). alk1 MO targets the border between exon 6 and intron 7, resulted in the skipping of exon 6 (*) or the failure of removal of intron 7 (**) as shown in the right PCR result. (B) Confocal stack images of the central arteries of 60 hpf TgBAC(pdgfrb:GFP);Tg(fli1a:Myr-mCherry) embryos injected with 3 ng alk1 MO. Boxed regions are enlarged to the bottom. Note that pdgfrbhigh MCs were not detected around central arteries but fli1a:Myr-mCherry-positive ECs became positive for pdgfrb:GFP (arrows). (C) Representative confocal stack images of the trunk vasculature of 72 hpf TgBAC(pdgfrb:GFP);Tg(fli1a:Myr-mCherry) larva treated with 100 μM DAPT from 24-36 Development: doi:10.1242/dev.165589: Supplementary information Development • Supplementary information hpf. Boxed regions are enlarged to the right. The quantitative analysis of DA-MC coverage is shown below the images. Note that DAPT treatment before the DA-MC emergence period (36 hpf-) did not affect the DA-MC emergence. (D) Representative confocal stack images of the trunk vasculature of 72 hpf TgBAC(pdgfrb:GFP);Tg(fli1a:Myr-mCherry) larva treated with 5 μM LY411575 from 24-72 hpf. (E) Confocal stack images of ISVs in the 96 hpf TgBAC(pdgfrb:GFP);Tg(fli1a:Myr-mCherry) embryos treated with DMSO (control), 100 µM DAPT from 48 hpf to 96 hpf, or DMSO from 48 hpf to 72 hpf and subsequent DAPT from 72 hpf to 96 hpf, as shown in the schematic model on the right top. Arrowheads indicate MCs in ISVs. a, aISV. v, vISV, The percentage of aISV covered by pdgfrbhigh MCs and the number of MCs in one aISV with MCs, as observed in the right images, are shown on the right. In embryos treated with DAPT from 48 hpf, only two out of 18 embryos showed the aISV with pdgfrbhigh MC. |

Effects of notch2 or notch3 depletion on MC emergence. (A) Confocal stack images of brain vessels in the 74 hpf TgBAC(pdgfrb:GFP);Tg(fli1a:Myr-mCherry) larvae injected with 10 ng control MO or 2-10 ng notch3 MO. The MC number in central arteries of larvae injected with control MO or 2-10 ng notch3 MO is shown on the bottom of confocal images. (B) Confocal stack images of trunk vessels in the 74 hpf Development: doi:10.1242/dev.165589: Supplementary information Development • Supplementary information TgBAC(pdgfrb:GFP);Tg(fli1a:Myr-mCherry) larvae injected with 10 ng control MO or 2-10 ng notch3 MO. Arrowheads indicate MCs in ISVs. a, aISV. v, vISV, The percent of aISV covered by pdgfrbhigh MCs is shown on the bottom of confocal images. The percentage of aISV with MCs was significantly reduced at 10 ng notch3 MO, however, even 10 ng notch3 MO did not completely block the MC-emergence in aISV and beneath the DA. (C) qPCR analysis of pdgfrb, cspg4, dll4, notch1b, and notch2 expression. The TgBAC(pdgfrb:GFP);Tg(fli1a:Myr-mCherry) or Tg(dll4:GFP) larvae at 4 dpf were subjected to FACS Aria and pdgfrb-GFP (-)/fli1a-mCherry (-), pdgfrb-GFP (+)/fli1a-mCherry (-), pdgfrb-GFP (-)/fli1a-mCherry (+), or dll4-GFP (+) cells were sorted. Then, after purification of mRNAs from sorted cells and subsequent cDNA synthesis, qPCR analysis was performed against targets in the figure. (D) pdgfrb:GFP (+) or fli1a:GFP (+) cells were sorted from 72 hpf TgBAC(pdgfrb:GFP) or Tg(fli1a:GFP) larvae and subjected to qPCR analysis of notch2, notch3, notch1a, and notch1b expression. While notch2 and notch3 expressions were higher in MC-containing pdgfrb+ population, notch1a and notch1b expression were higher in ECcontaining fli1a+ population. (E) The MC number in BCA and PCS of 78 hpf larvae injected with 10 ng control MO, 10 ng notch2 MO, or 5 ng each of notch2 and notch3 MOs, shown in Fig. 3A. (F, G) qPCR analysis of notch2 or notch3 expression in whole 72 hpf larvae injected with 5 ng notch3 MO or 5 ng notch2 MO, respectively. **p<0.01, and ****p<0.0001, significant difference between indicated two groups. n.s., not significant between two groups |
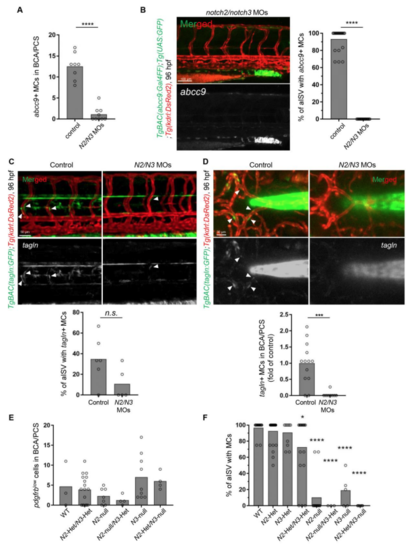
Effects of both notch2 and notch3 depletion on MC emergence. (A) The number of abcc9+ MCs in BCA and PCS in Fig. 3D. (B) Confocal stack images of trunk vessels in the 96 hpf TgBAC(abcc9:GAL4FF);Tg(UAS:GFP);Tg(kdrl:DsRed2) larva injected Development: doi:10.1242/dev.165589: Supplementary information Development • Supplementary information with 5 ng each of notch2 MO and notch3 MO (N2/N3 MOs). The percent of aISV covered by abcc9+ MCs is shown on the right. (C, D) Confocal stack images of trunk vessels (C) or vessels located on cerebral base (D) in the 96 hpf TgBAC(tagln:GFP);Tg(kdrl:DsRed2) larvae injected with 5 ng each of notch2 MO and notch3 MO (N2/N3 MOs). The percent of aISV covered by tagln+ MCs (C) or the number of tagln+ MCs in BCA/PCS (D) are shown on the bottom of images. (E) The number of pdgfrblow cells in BCA and PCS of notch2/notch3 (N2/N3) mutants observed in Fig. 3E. No significant differences between WT and any mutants. (F) The percent of aISV with MCs in notch2/notch3 (N2/N3) mutants observed in Fig. 3G. *p<0.05, ***p<0.001, and ****p<0.0001, significant difference comparing to control or WT. n.s., not significant between two groups. |

Effects of notch2/3, dll4, or notch1b depletion. (A) qPCR analysis of dlc and dll4 expression in whole 72 hpf larvae injected with 5 ng each of notch2 and notch3 MOs (N2/N3 MOs). (B) Confocal stack images of trunk vessels in the 78 hpf TgBAC(pdgfrb:GFP);Tg(fli1a:Myr-mCherry) larvae injected with control MO, 10 ng dll4, or 10 ng notch1b MO. a, aISV. v, vISV. Yellow or blue arrowheads, pdghrbhigh MCs in aISV or vISV, respectively. (C) Dorsal view of confocal stack images of brain vessels (mainly CtAs) in the 78 hpf TgBAC(pdgfrb:GFP);Tg(fli1a:Myr-mCherry) larvae injected with control MO, 10 ng dll4, or 10 ng notch1b MO. |

Visualization of Notch activity. (A) The 52 hpf TgBAC(notch2:Notch2- GAL4FF);Tg(UAS:GFP) uninjected embryos (Control siblings) or embryos injected with 10 ng notch2 MO or 2 ng rbpj MO. Bright field images are inserted bottom left of each UAS:GFP images. Note that GFP expression was canceled by notch2 MO whereas that was enhanced by rbpj MO. (B) The 72 hpf TgBAC(notch2:Notch2-GAL4FF);Tg(UAS:GFP) Development: doi:10.1242/dev.165589: Supplementary information Development • Supplementary information larvae treated with DMSO or 100 μM DAPT from 22 to 72 hpf. Boxed regions are enlarged to bottom left of each images. GFP signals detected in the heart (blue arrows) or in the eye (white arrows) in control siblings were inhibited in DAPT treated larvae, although the reduction of GFP signal in trunk was not apparent in this DAPT treatment condition. (C) Confocal stacked images of 54 hpf brain (dorsal view) of TgBAC(notch2:Notch2- GAL4FF);Tg(UAS.GFP);TgBAC(pdgfrb:mCherry) embryos. Arrows indicate faint Notch2- activation in a CtA-MC. Embryos with Notch2-activity positive MCs in brain at 54 hpf were 7.14 % (1/14 embryos). (D) Confocal stacked images of trunk region of 120 hpf TgBAC(pdgfrb:GFP);Tg(TP1:H2B-mCherry) larva. Arrows indicate TP1 positive MCs. |

Effects of overexpression of N2ICD or N3ICD on MC markers expression. (A) The 27 hpf Tg(TP1:H2B-mCherry) embryos injected with a plasmid encoding CMV:GFP-N2ICD (right) or uninjected control (left). Overexpression of GFP-N2ICD enhanced TP1:H2B-mCherry expression especially around yolk sac. (B) Confocal stack images of the 27 hpf Tg(TP1:H2B-mCherry) embryos injected with a plasmid encoding CMV:GFP-N2ICD. Boxed regions are enlarged below. In yolk tube, all GFP-N2ICD positive Development: doi:10.1242/dev.165589: Supplementary information Development • Supplementary information cells were also positive for TP1:H2B-mCherry (a). While, some N2ICD-GFP positive cells were also positive for TP1:H2B-mCherry (arrows) but some of them were negative for the TP1:H2B-mCherry (arrowheads) in the trunk (b). This data may suggest the differences of the sensitivity to N2ICD among the cell types. (C) Confocal stack images of the 29 hpf or 50 hpf TgBAC(pdgfrb:mCherry) embryos injected with a plasmid encoding CMV:GFP-N2ICD. Note that GFP-N2ICD could not induce pdgfrb:mCherry expression in any body parts including yolk sac even though GFP-N2ICD clearly enhanced TP1:H2B-mCherry expression, as shown in A and B. (D, E) Confocal stack images of the 29 hpf, 33 hpf, or 50 hpf TgBAC(pdgfrb:mCherry) embryos injected with a plasmid encoding CMV:GFP-N3ICD (D) or GFP-N3ICD mRNA (E). N3ICD could not induce pdgfrb:mCherry expression. (F, G) Confocal stack images of the 50 hpf TgBAC(abcc9:GAL4FF);Tg(UAS:GFP) (F) or TgBAC(tagln:GFP) embryos (G) injected with a plasmid encoding CMV:mCherry-N2ICD. N2ICD could not induce abcc9- nor tagln-reporter expression |