
- Title
-
The microRNA, miR-18a, regulates NeuroD and photoreceptor differentiation in the retina of the zebrafish
- Authors
- Taylor, S.M., Giuffre, E., Moseley, P., Hitchcock, P.F.
- Source
- Full text @ Dev. Neurobiol.

ZFIN is incorporating published figure images and captions as part of an ongoing project. Figures from some publications have not yet been curated, or are not available for display because of copyright restrictions. |

Knockdown with morpholinos targeted to miR‐18a, miR‐18b, or miR‐18c results in more differentiated cone photoreceptors. (A) ZPR‐1 (cone) immunolabeling in 70 hpf larvae that were injected at the single‐cell stage with standard control, miR‐18a, miR‐18b, or miR‐18c morpholinos; note that, due to sequence similarities, each morpholino might comprehensively knock down miR‐18a, b, and c. (B) In situ hybridization for miR‐18a, comparing expression in larvae injected with standard control morpholino (left) with miR‐18a knockdown (right). (C) Cone photoreceptor counts presented as the mean of one eye per fish (n = 3) counted in the centermost cross section in the vicinity of the optic nerve. (D) Total number of BrdU‐labeled cells presented as the mean of one eye per fish (n = 3) counted in the centermost cross section in the vicinity of the optic nerve. Error bars show standard deviation and counts were statistically compared using a Student’s ttest. [Colour figure can be viewed at wileyonlinelibrary.com] |
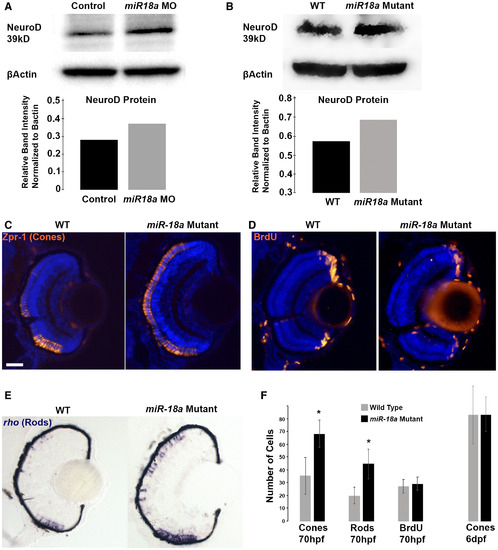
Loss of miR‐18a increases NeuroD protein levels and the number of differentiated photoreceptors. Western blot on 48 hpf embryo heads (n = 40) comparing NeuroD protein levels between standard control MO‐injected and miR‐18a MO‐injected embryos (A) and between the WT and miR‐18a‐/‐‐mutant embryos (B) with corresponding quantification graphs. In the WT compared with the miR‐18a‐mutant larvae at 70 hpf, immunolabeling for mature cone photoreceptors (C: Zpr‐1) and cells in the S‐phase of the cell cycle (D: BrdU); and in situ hybridization for rod photoreceptors (E: rhodopsin); scale bar = 0.50 μm. (F) Quantification of cones (n ≥ 14 larvae), rods (n ≥ 8 larvae), and BrdU+ cells (n ≥ 7 larvae) in 70 dpf retinas. Error bars represent standard deviation; cell counts compared with a Student’s t test and asterisks indicate P < 0.05. [Colour figure can be viewed at wileyonlinelibrary.com] |

tgif1 mutant larvae have fewer photoreceptors, increased miR‐18a expression, and reduced NeuroD protein levels. (A) Immunolabeling for cone photoreceptors (Zpr‐1) at 70 hpf in the WT larvae injected with standard control morpholinos (SC MO), tgif1‐mutant larvae injected with SC MO, tgif1‐mutant larvae injected with miR‐18a morpholinos, with corresponding images showing in situ hybridization for miR‐18a in the same retinas; scale bar = 50 μm. (B) Cone photoreceptor counts in retinal cross sections (n = 3 larvae each) in fish corresponding to the images in (A). (C) Standard qPCR showing pre‐miR‐18a expression in 70 hpf WT larvae compared with tgif1 mutants (n = 40 heads); normalized to βactin and shown relative to let‐7b expression. (D) Standard qPCR comparing neuroD mRNA expression in 70 hpf larvae between WT and tgif1 mutants (n = 40 heads); normalized to βactin and shown relative to ccnb1 expression. (E) Western blot showing NeuroD protein levels in 70 hpf WT compared with tgif1‐mutant fish (n = 40 heads). (F) Quantification of the average band intensities in E. All error bars represent standard deviation and comparisons were made with Student’s ttests (asterisks indicate P < 0.05). [Colour figure can be viewed at wileyonlinelibrary.com] |