- Title
-
Topography of a Visuomotor Transformation
- Authors
- Helmbrecht, T.O., Dal Maschio, M., Donovan, J.C., Koutsouli, S., Baier, H.
- Source
- Full text @ Neuron
|
Optogenetic Mapping of the Tectum Reveals a Motor Map (A) Schematic drawing of the optogenetic setup. Zebrafish larvae (5–7 dpf; Gal4s1013t; UAS:ChR2-mCherry; UAS:paGFP) are head-embedded in agarose, whereas the tail is free to move. A 50-μm optic fiber is used to stimulate ChR2-expressing tectal neurons at 473 nm while the behavior is recorded at 344 fps. (B) Optogenetic activation of tectal neurons triggers behavior. Different elicited behavioral outcomes are shown as time projections along with the corresponding tail kinematics. Fish were stimulated for 3 s (blue background). (C) Characterization of the behavior. DBSCAN (density-based spatial clustering of applications with noise) clustering of the mean bout angle and maximum amplitude of the first bouts triggered in each stimulation reveal two kinematically distinct behavioral outcomes: approaches and escapes. On each axis, the probability density functions are displayed for the two behaviors. (D) Average of maximum amplitudes and mean bout angles for the different clusters of behavior. (E) Response probabilities for ChR2-expressing and non-expressing fish (∗∗p = 1.3 × 10⁻⁶). (F) Fish co-expressing ChR2 (red) and paGFP were used to mark the stimulated region by photoconverted paGFP (white) after photostimulation with ChR2. (G) The mean bout angle increases with stimulations along the anterior-posterior axis (n = 20 fish), estimated by the center of gravity of photoactivated neurons. (H) Influence of the initial eye position (i.e.p.) on the induced behavior. Shown is a time projection of the optogenetically induced behavior in fish with the eyes freed. The colored arrows indicate the left or right movements of the tail depending on the initial eye position (white arrowheads). Right: traces of eye and tail angles for the time projections, highlighting the stimulation (blue) and the initial position of the contralateral eye (dashed red line). (I) Quantification of the mean bout angle in relation to the initial eye position. For all induced bouts (n = 8 fish, ∗∗p = 7.4e−4), red points indicate nasal and blue point temporal eye positions. The probability density histograms show a bimodal distribution for the eye position, resulting in a shift in the distribution of tail angles. Right: the shift in mean bout angle depending on the eye position for eight fish. The scale bar represents 50 μm. Data are presented as mean ± SEM. See also Figures S1 and S2. |
|
The Tectal Projectome Reveals at Least Seven Different Classes of Projection Neurons (A) Single-cell reconstruction strategy. Crossing BGUG (Brn3c:Gal4;UAS:GFP) fish to Gal4s1013t; elavl3:lyn-tagRFP fish results in stochastic labeling of individual tectal neurons expressing GFP (green), whereas pan-neuronally expressed lyn-tagRFP (magenta) serves as a registration reference channel across different fish. (B) Example z-projection of a single tectal projection neuron labeled with GFP in a fish expressing pan-neuronally lyn-tagRFP. (C) Tracing of the labeled neuron, color-coded with the Strahler number of each point, highlighting arbor terminals. (D) Summary of all neuronal types found (133 projection neurons). Shown is a connectivity matrix revealed by manual annotation of innervated tectal and extra-tectal targets of every neuron subclass (black, innervated; gray, absent). The ordering was determined by hierarchical clustering of the extra-tectal targets. Seven main projection classes can be distinguished (I–VII; the dendrogram is shown in Figure S4A), determined by their main projection targets, with 29 subclasses differing in final target structures (compare the wiring diagram in Figure S5). The number of cells for each subclass is indicated below the table. (E) Cellular atlas of tectal projection neurons, visualized by color-coding every cell by its projection class. (F) Main arborization targets for every main projection class, determined by kernel density estimation of the last 10 points of neurons’ skeletons with Strahler numbers of 1 (leaves) for points outside of the tectum (more detailed information in Figure S4). The scale bar represents 100 μm. See also Figures S4 and S5. |
|
Different Projection Classes Shown is a detailed representation of arborization densities for all eight projection classes (color-coded) together with the single-cell tracings of the corresponding neurons (black traces). For each class, different views in the anteroposterior, dorsoventral, and mediolateral axis are shown. Scale bars represent 100 μm. See also Figures S4 and S5. |
|
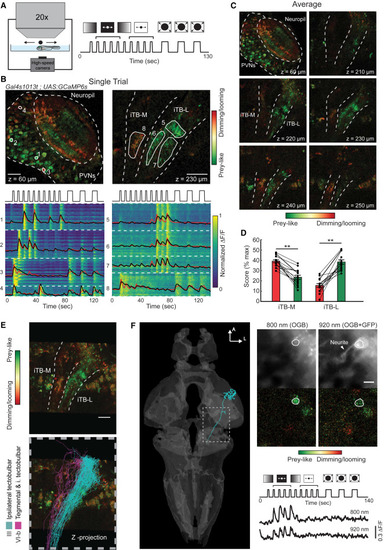
The iTB-L and iTB-M Are Differentially Tuned to Prey-like and Dimming/Looming Stimuli (A) Schematic drawing of the 2P imaging experiment together with the panel of different visual stimuli used for calcium imaging (see details in STAR Methods). (B) Single trial responses to the stimuli recorded in the tectum and the projections ventral to the tectum in a monocularly enucleated fish (Figure S6). Top: single planes recorded in the tectum (left) and projections (right) with pixels color-coded by preference for prey-like or dimming/looming stimuli. Note the different responses in the iTB-M and iTB-L. Bottom: single pixel responses organized by ROIs (white dashed line). Black, average calcium response for each ROI; red: regression model. (C) Average responses of a minimum of three repetitions of the protocol for the different planes imaged, highlighting the spatial separation of prey-like and dimming/looming responses in the lateral and medial iTB. (D) Differential responses to prey-like and dimming/looming stimuli in the iTB-M and iTB-L, (iTB-M, ∗∗p = 1.7 × 10⁻⁶; iTB-L, ∗∗p = 4.7 × 10⁻⁷ by t test for paired samples). Data are presented as mean ± SEM. (E) Registration of single-cell reconstructions of class III (cyan) and VI-b (magenta) projection neurons that descend in the iTB-L and iTB-M to a z-projection of functional imaging data. The scale bar represents 25 μm. (F) Functional responses of a single class III neuron labeled with BGUG and OGB1-AM. The cell shows tuning to prey-like stimuli imaged at 800 nm and 920 nm. The scale bar represents 5 μm. See also Figure S6. |
|
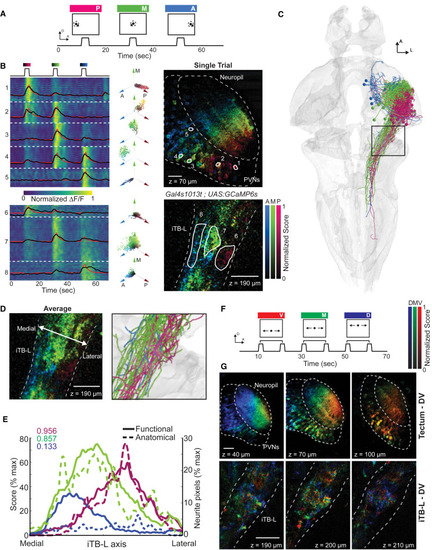
Retinotopic Target Information Is Maintained along the AP Axis in iTB-L Axons (A) Visual stimulus protocol of a black dot (8°) circling around a center point for 3 s in three different positions of the visual field (posterior, medial, and anterior). (B) Single trial representation of responses to the three stimulus positions. Left: a raster plot of the ΔF/F traces for every pixel together with an average (black) and fitted (red) response for each ROI (right). Right: the scores from a linear regression to the three stimuli color-coded in an HSV image that was hue-shifted to increase the contrast. Dashed lines represent the tectal neuropil, periventricular neurons, and the lateral portion of the iTB, whereas solid lines show the outline of manually drawn ROIs. Center: a polar plot of pixel responses in each ROI as a two-dimensional projection. The hue (angle) represents the tuning to the stimulus position, whereas the saturation (radius) shows the normalized score of each pixel. (C) Anatomical substrate of the conserved retinotopic output. Neurons in the reference brain of projection class III, targeting solely the iTB-L, are color-coded with respect to their cell body position along the anterior-posterior axis of the tectum. (D) Comparing the average functional responses of the iTB-L (three trials) with the anatomical wiring (enlargement of black box in C) illustrates a similar representation of information flow. (E) Overlap of functional (solid lines, n = 3 fish) and anatomical (dashed lines) distributions in the iTB-L. Pearson correlation coefficients of the functional and corresponding anatomical distributions are shown in the top left corner. (F) Modified stimulus protocol to investigate the dorsal-ventral representation, including stimulus movements along three elevations spanning, in total, 30° (ventral, medial, and dorsal). (G) Average responses for three trials in three different planes imaged in the tectum and the iTB. Although the elevation of the object is encoded along the dorsal-ventral axis in the tectum, the signals in the iTB are distributed. The scale bars represent 20 μm. See also Figure S7. |
|
Activating iTB-L Projection Neurons Is Sufficient to Evoke Directed Approach Behavior (A) 2P optogenetic stimulation of the iTB-L. ChR2-expressing fish in the tectum were mounted under a 2P microscope to stimulate regions of the iTB-L. (B) Example of stimulated zones in a Gal4:s1013t;UAS:ChR2-mcherry fish. The cyan outline represents the targeted area (10.5 × 16.7 μm2) to induce swims, whereas the gray box indicates the control stimulation where no ChR2 is expressed. (C) Stimulation protocol and behavioral outcome. The laser was repeatedly scanned (32.7 Hz) for 3 s with 920 nm over the target area. The target stimulation (cyan boxes) consistently induced ipsilateral turns, whereas behavior only rarely coincides with stimulation of the control region (gray box). (D) Quantification of average stimulation efficiency for target (cyan) and control (gray) stimulations in three fish (∗p = 3.8 × 10⁻²). (E) Mean bout angle distributions for the most common bout types (kernel density estimation > 95%) for five fish. (F) Correlation between stimulation site and tail directionality (∗∗p = 1.3 × 10⁻³). Comparing the registered stimulation areas for five fish indicates a bias in bout directionality that increases with medial to lateral position in the iTB-L. The scale bar represents 50 μm. Data are presented as mean ± SEM. |


